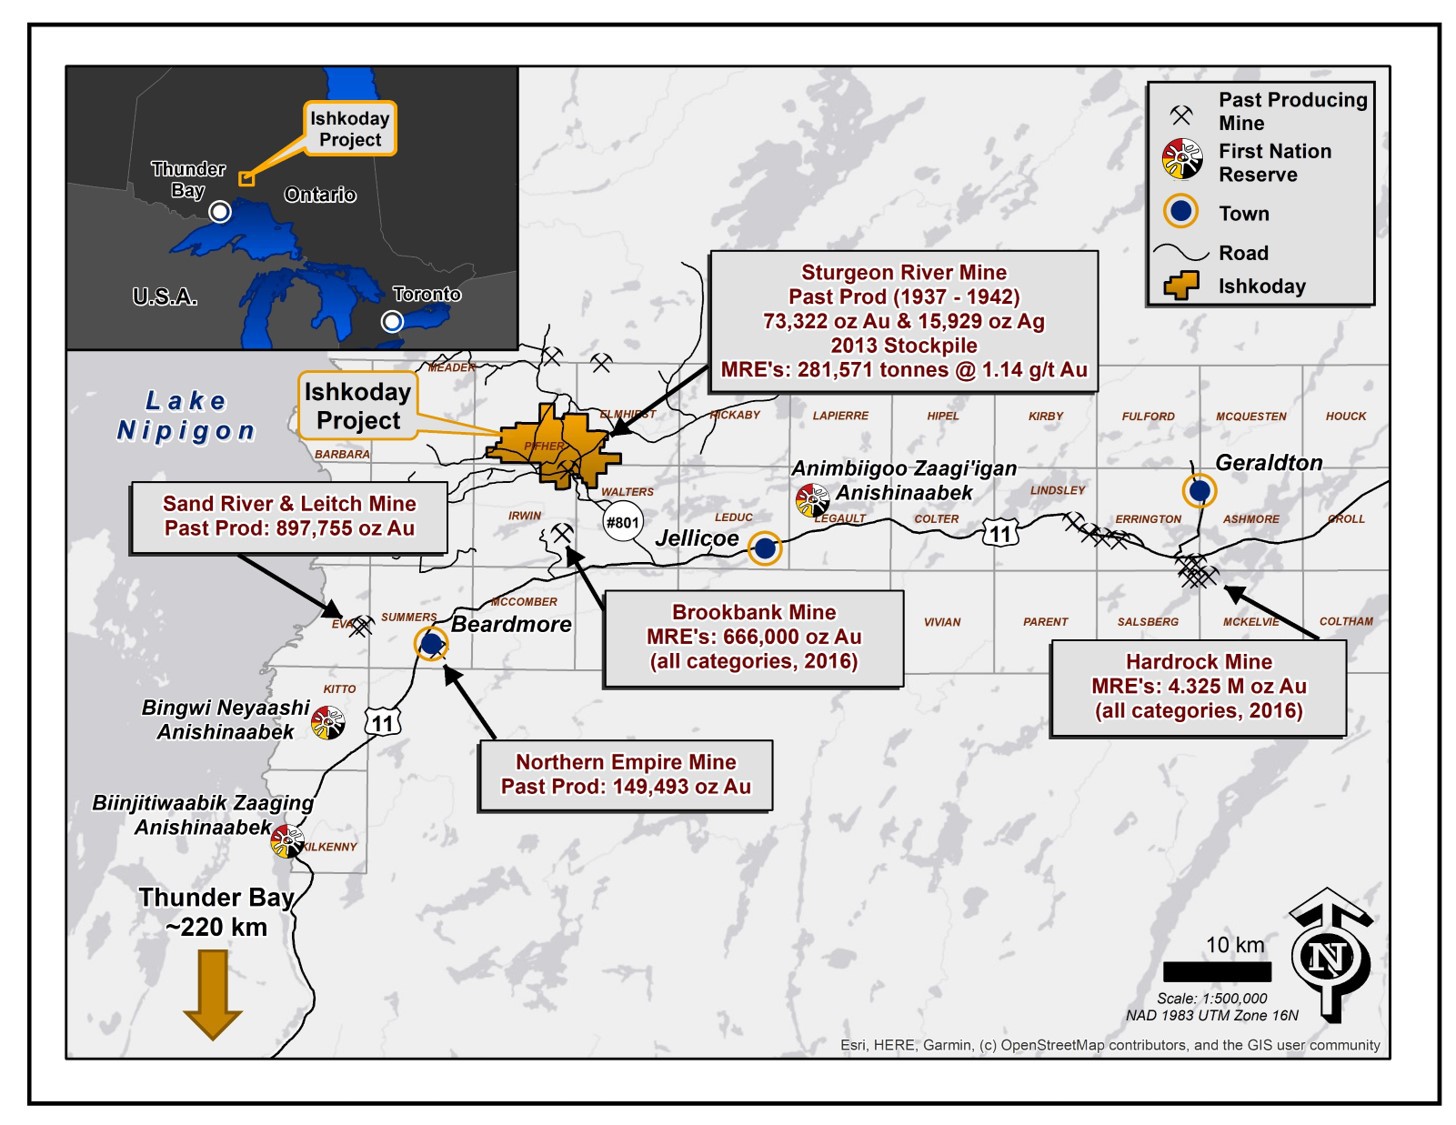
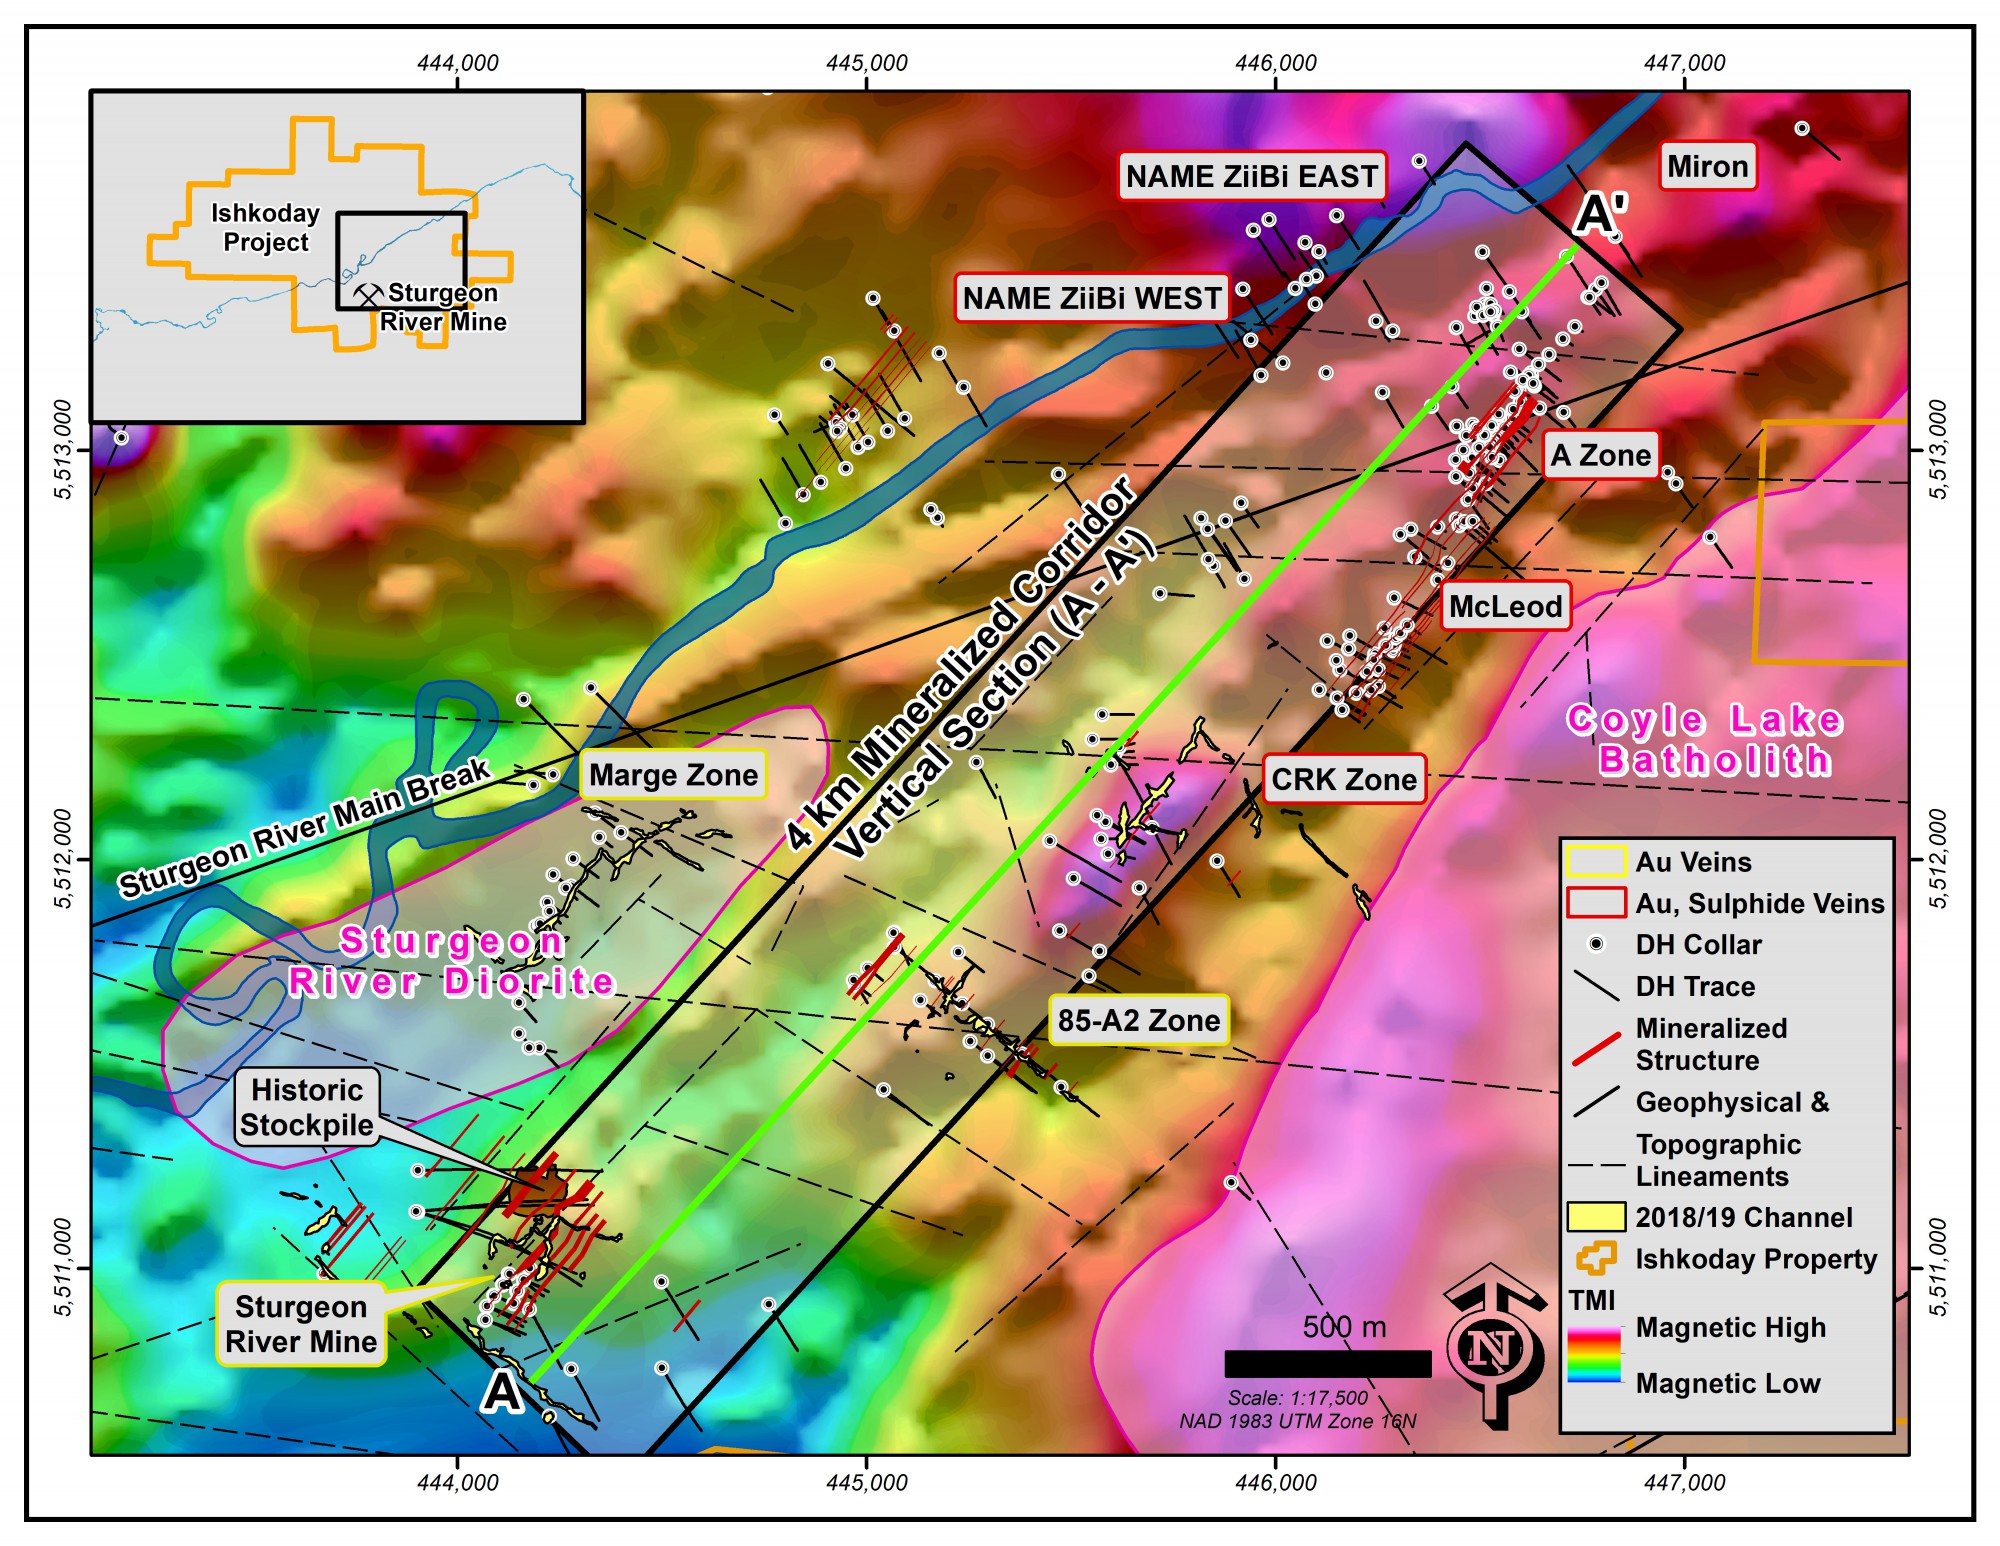
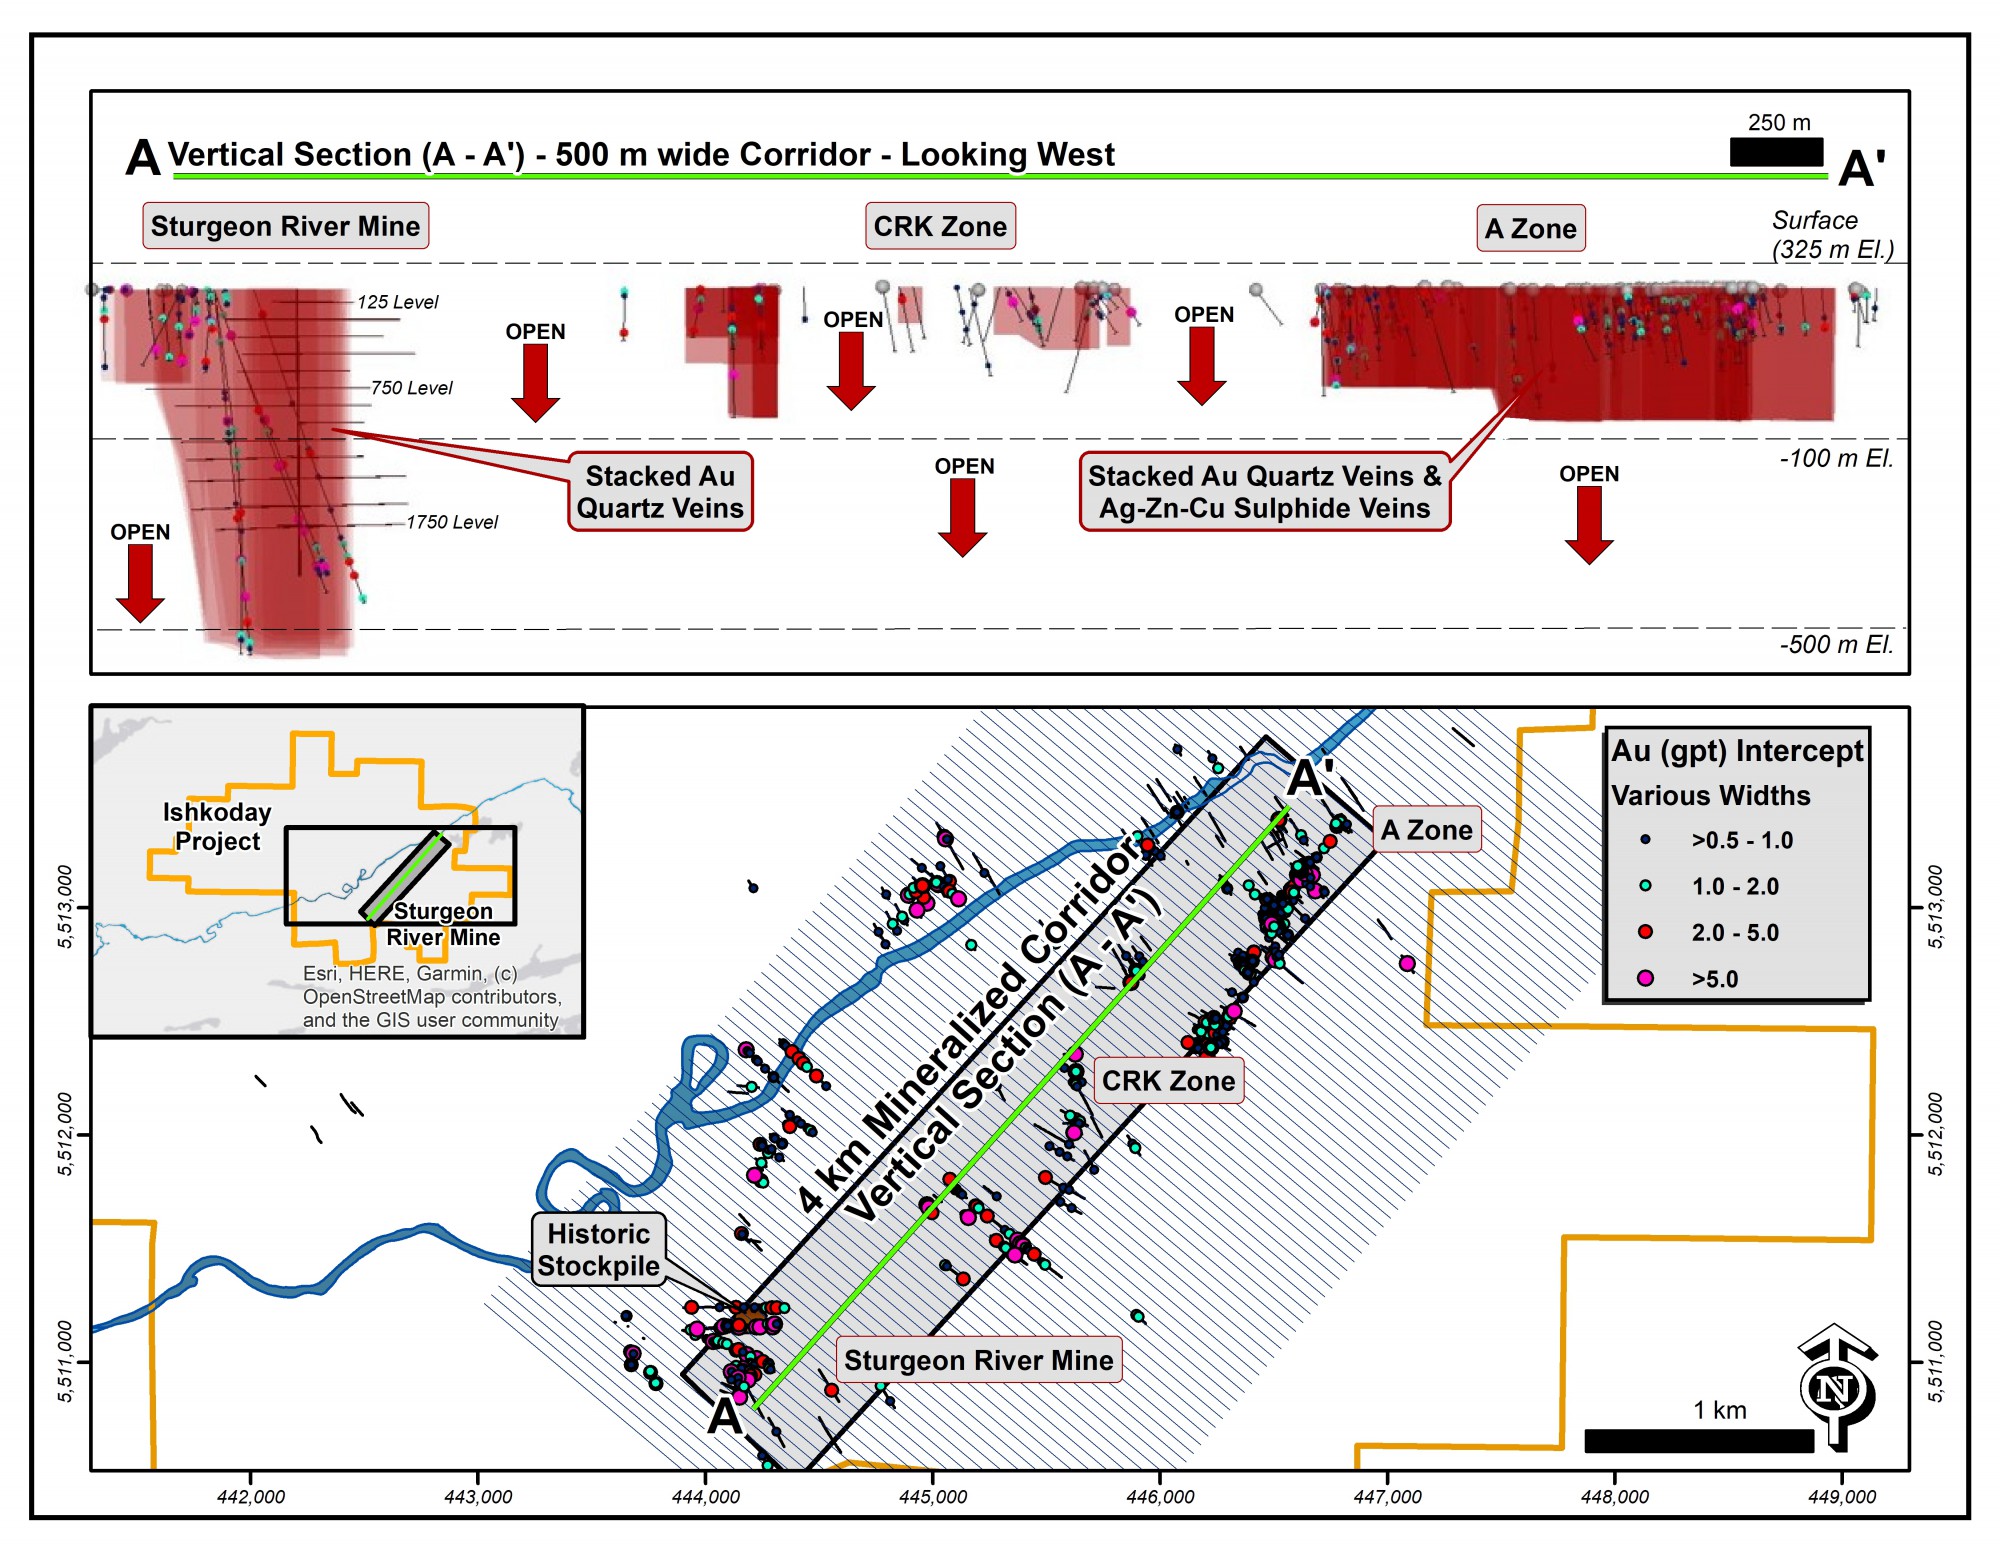
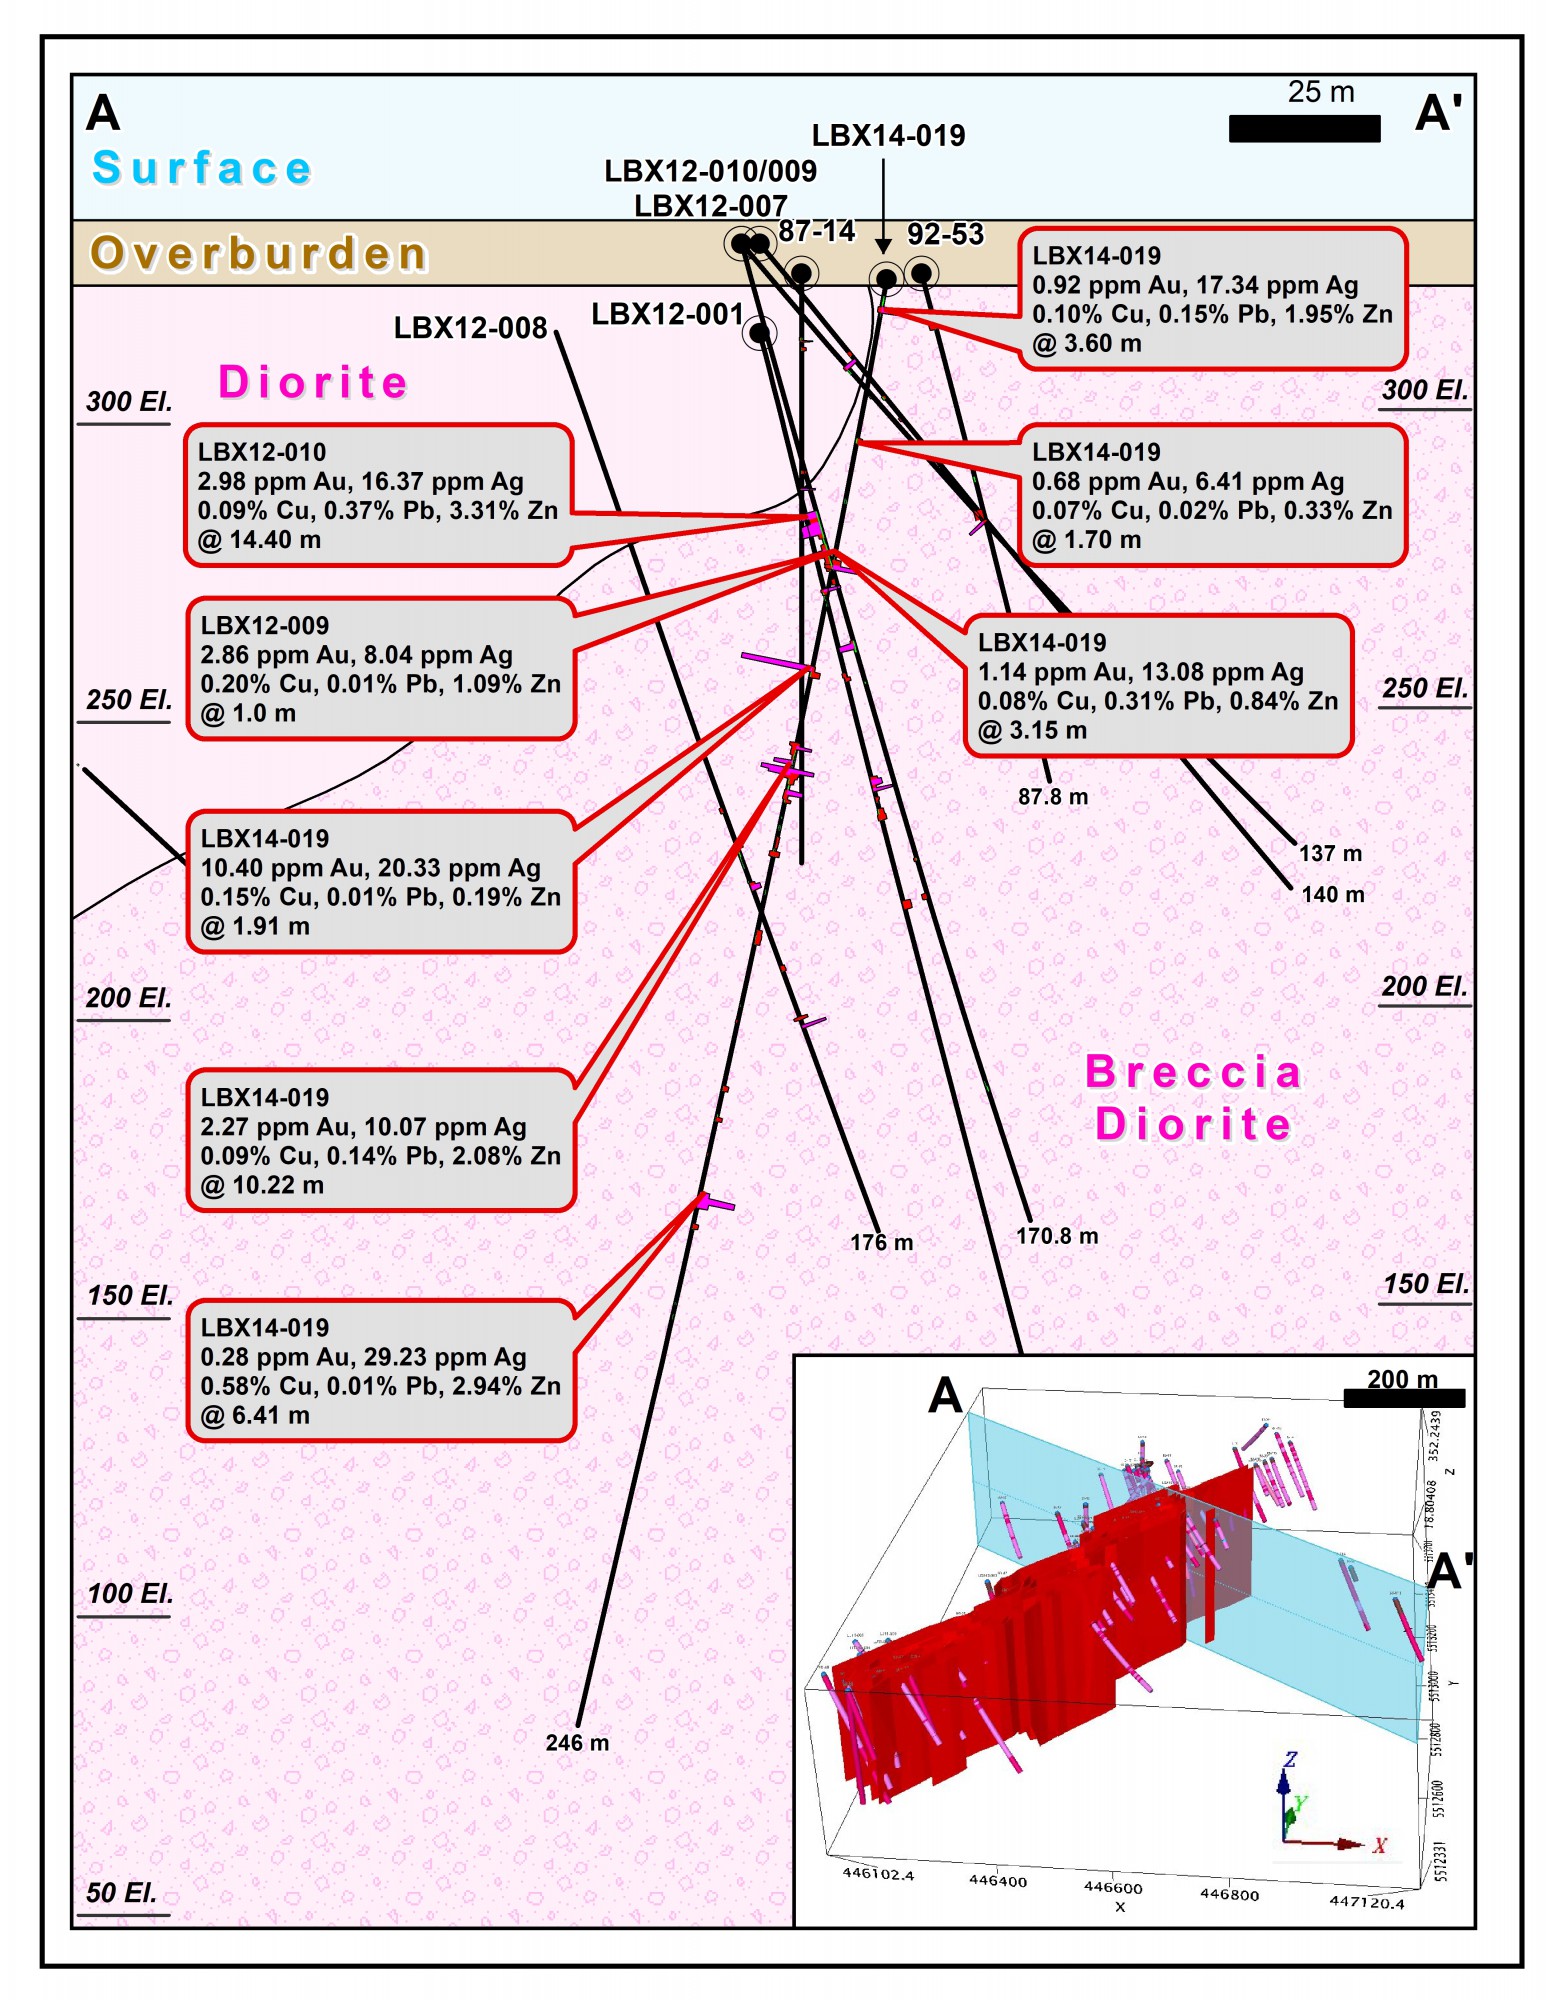
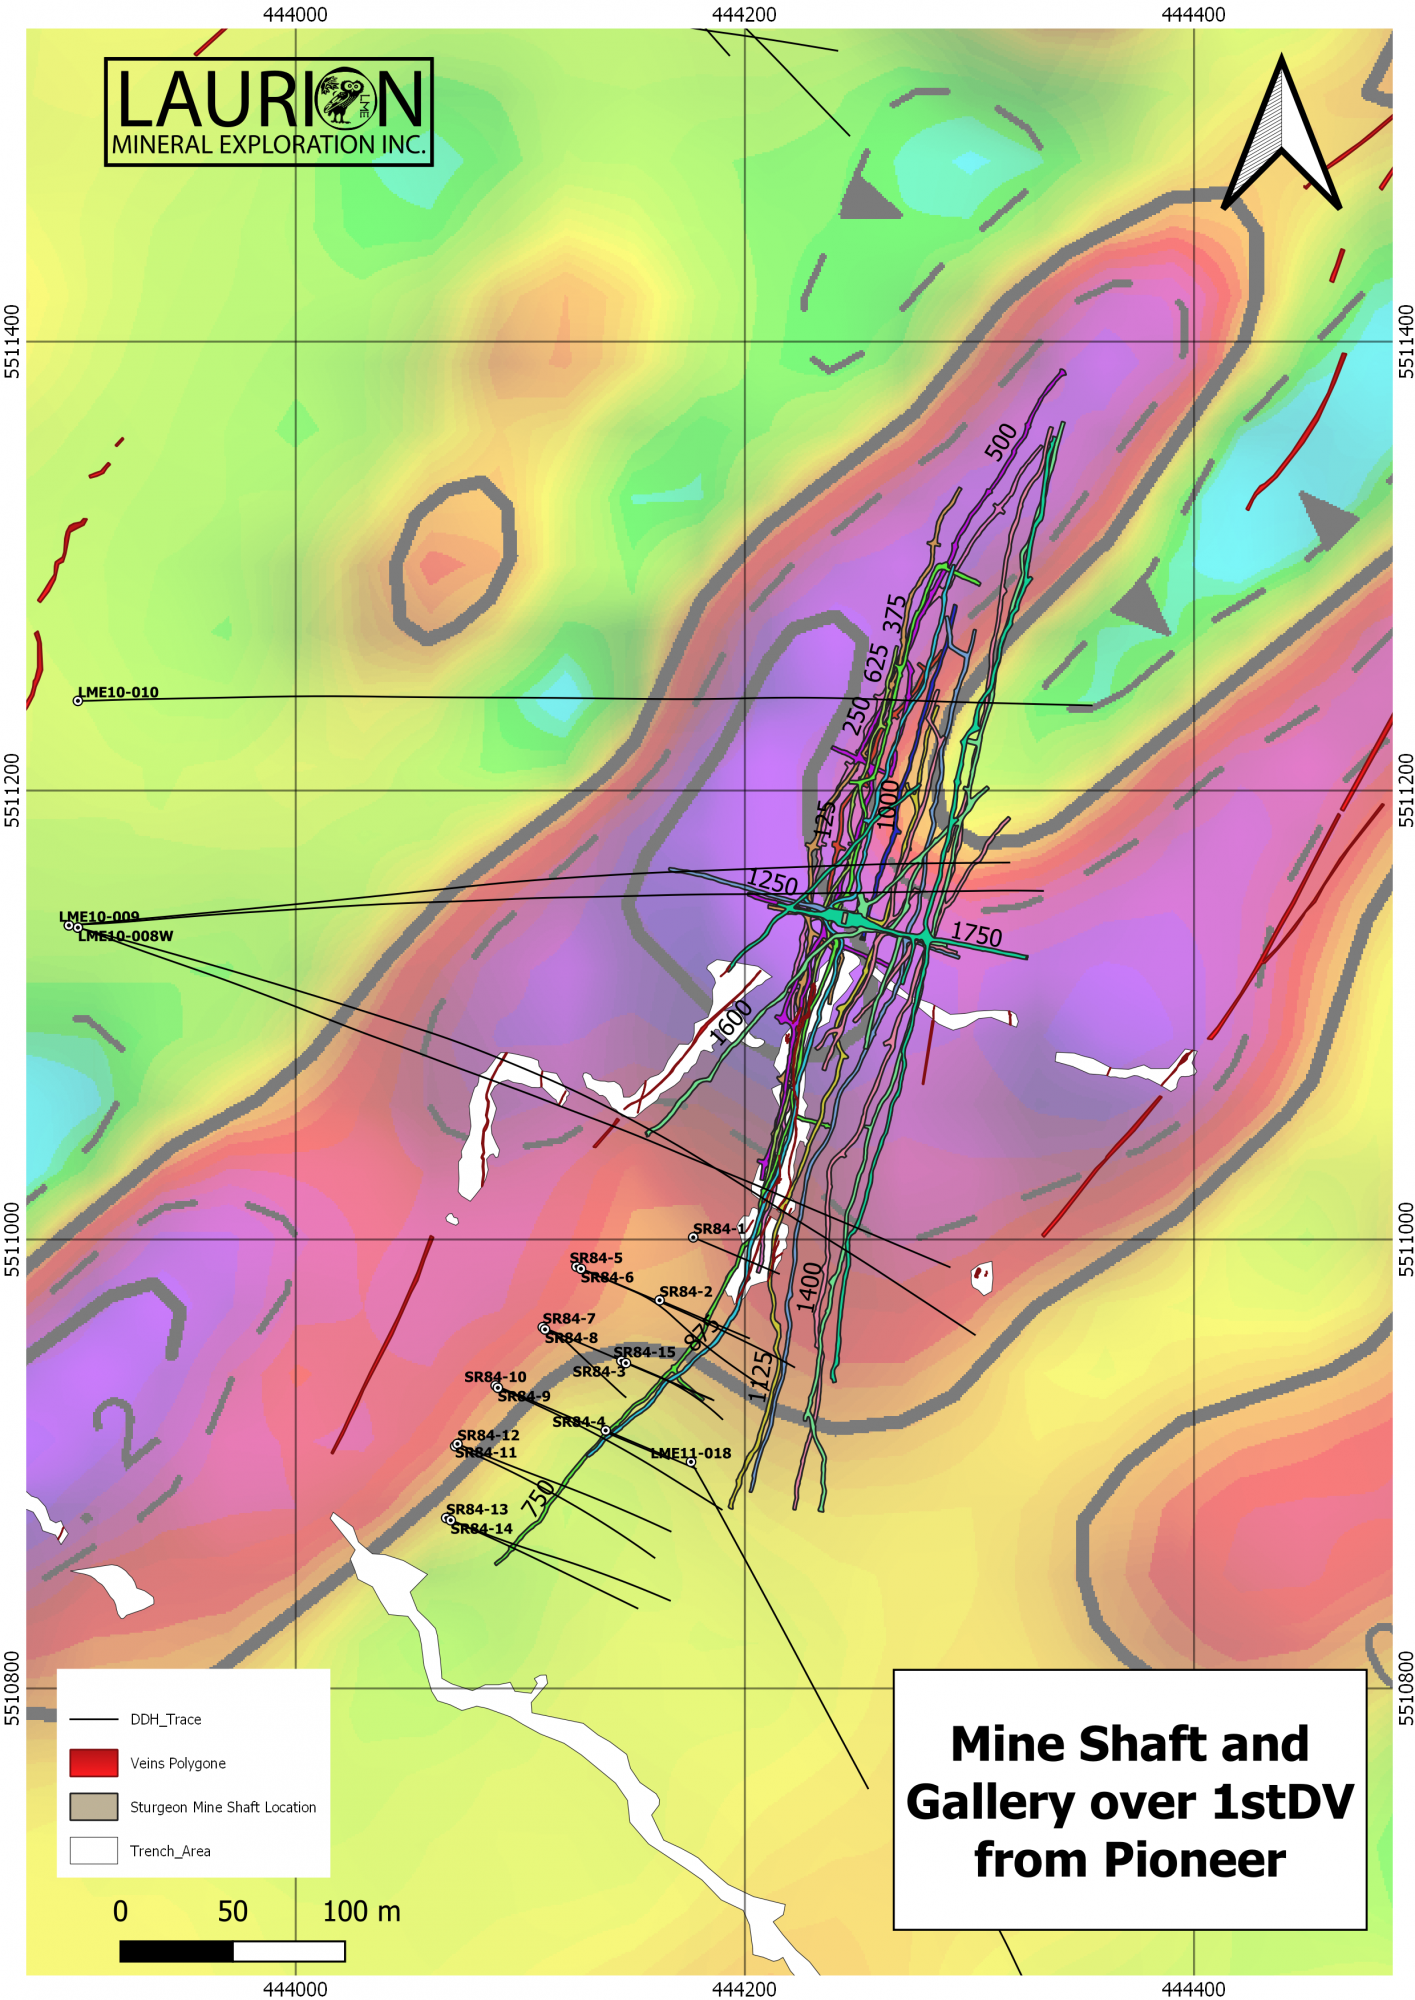
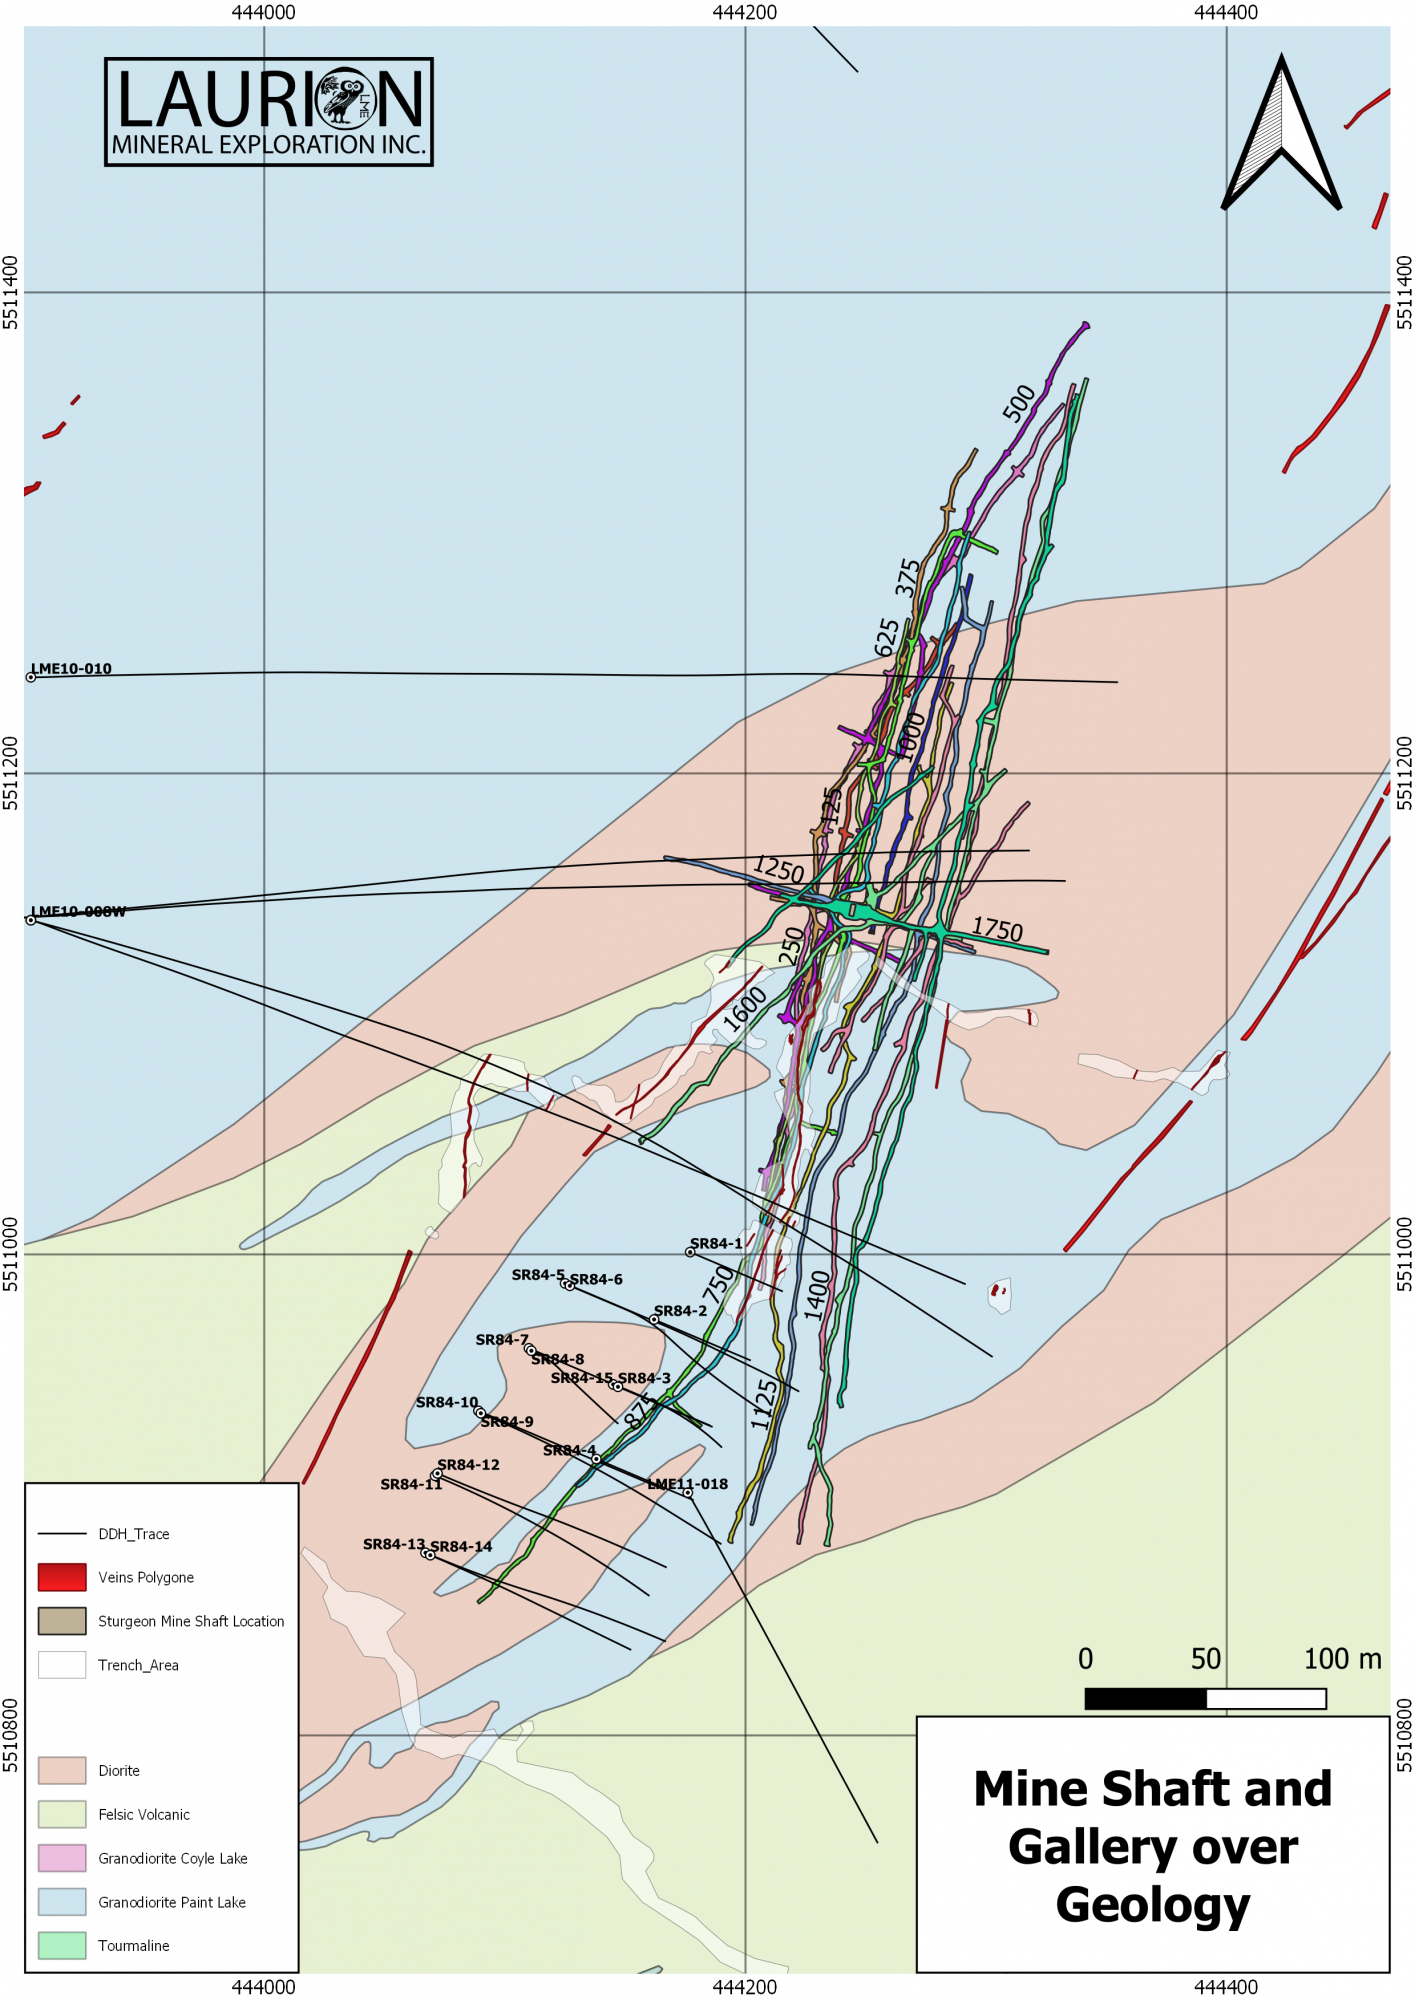
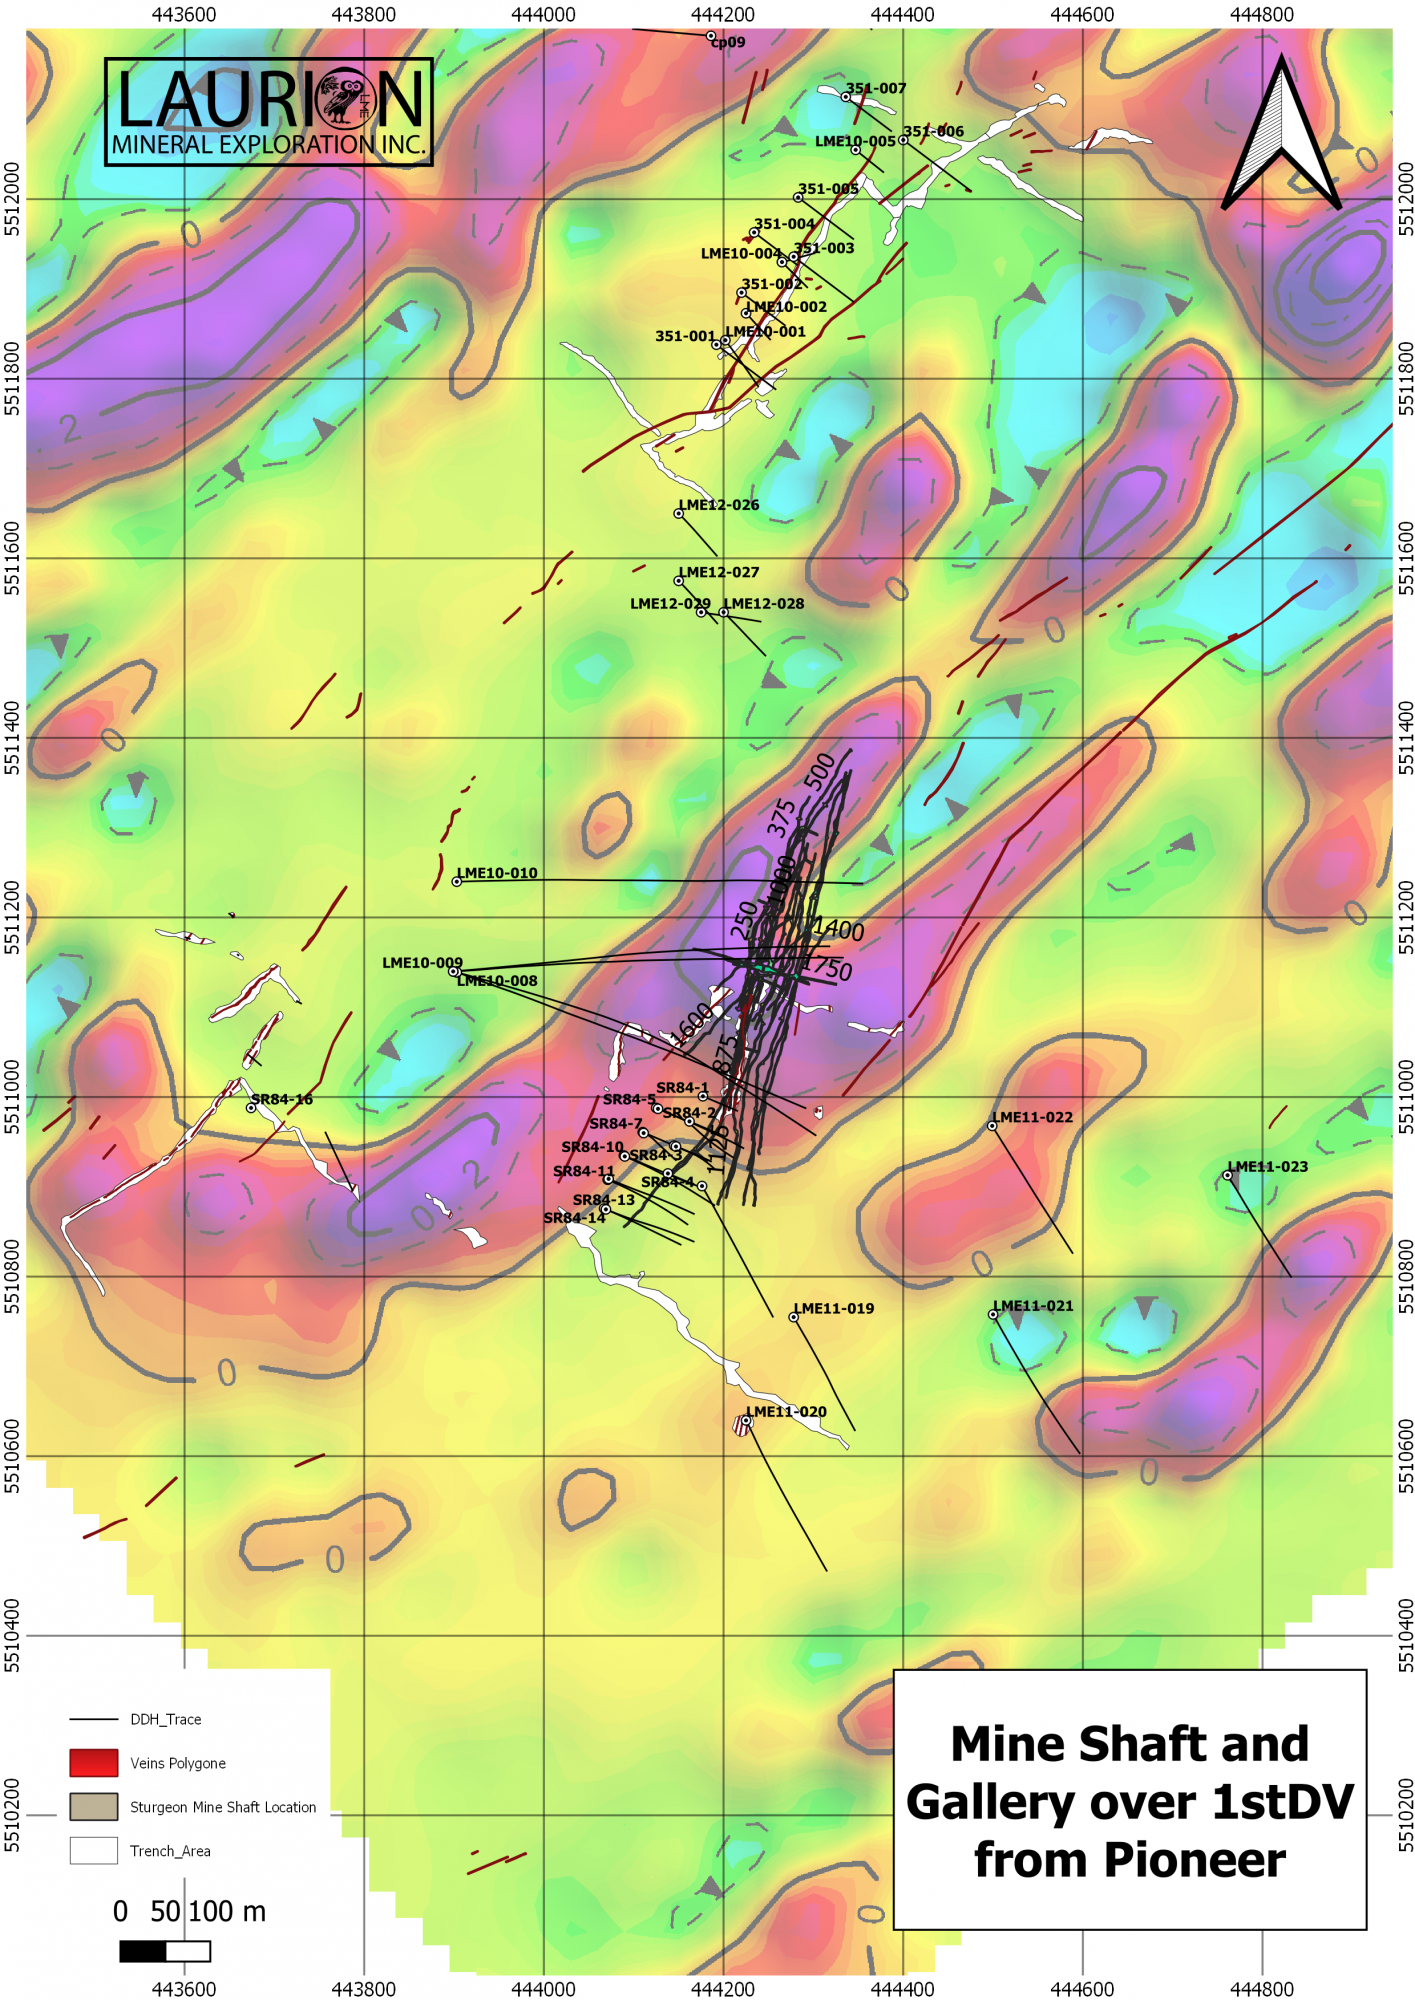
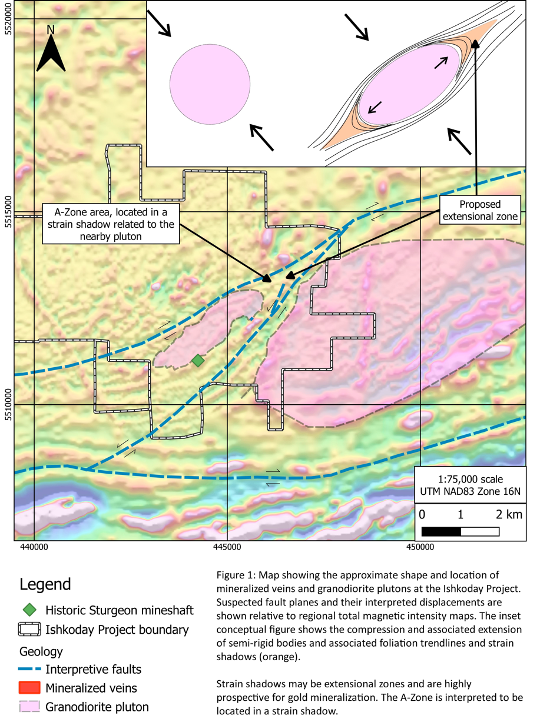
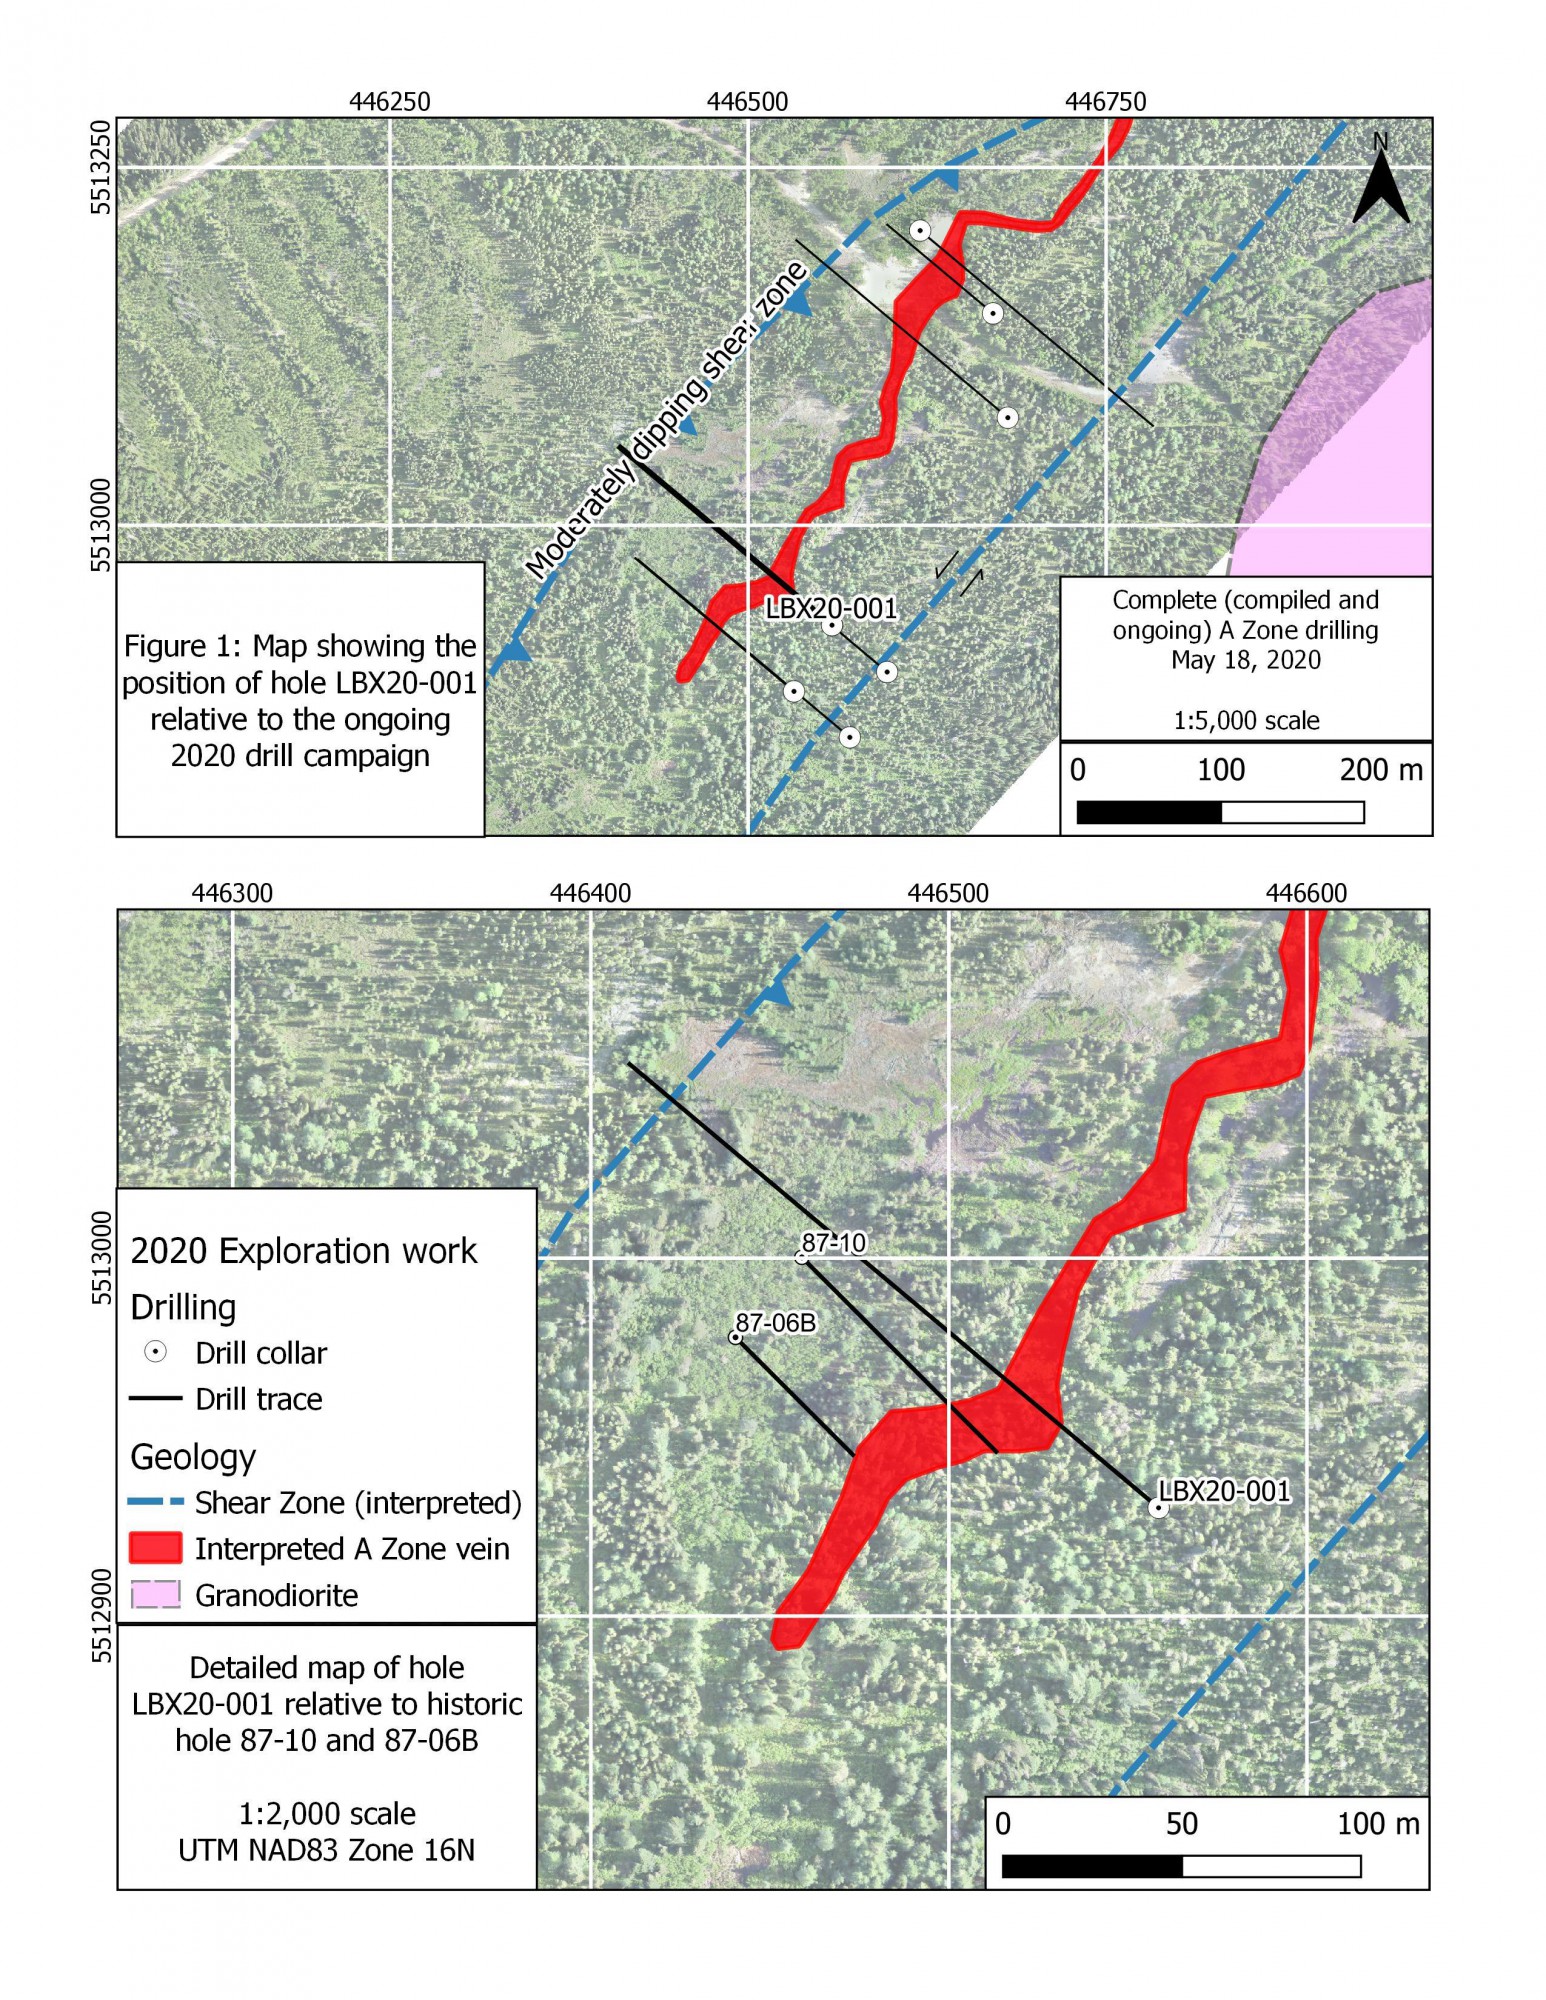
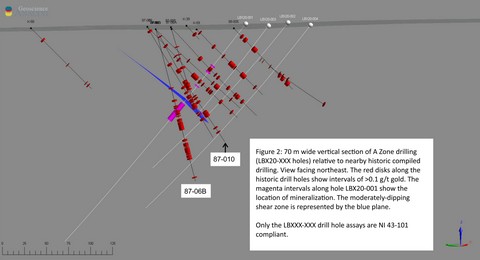
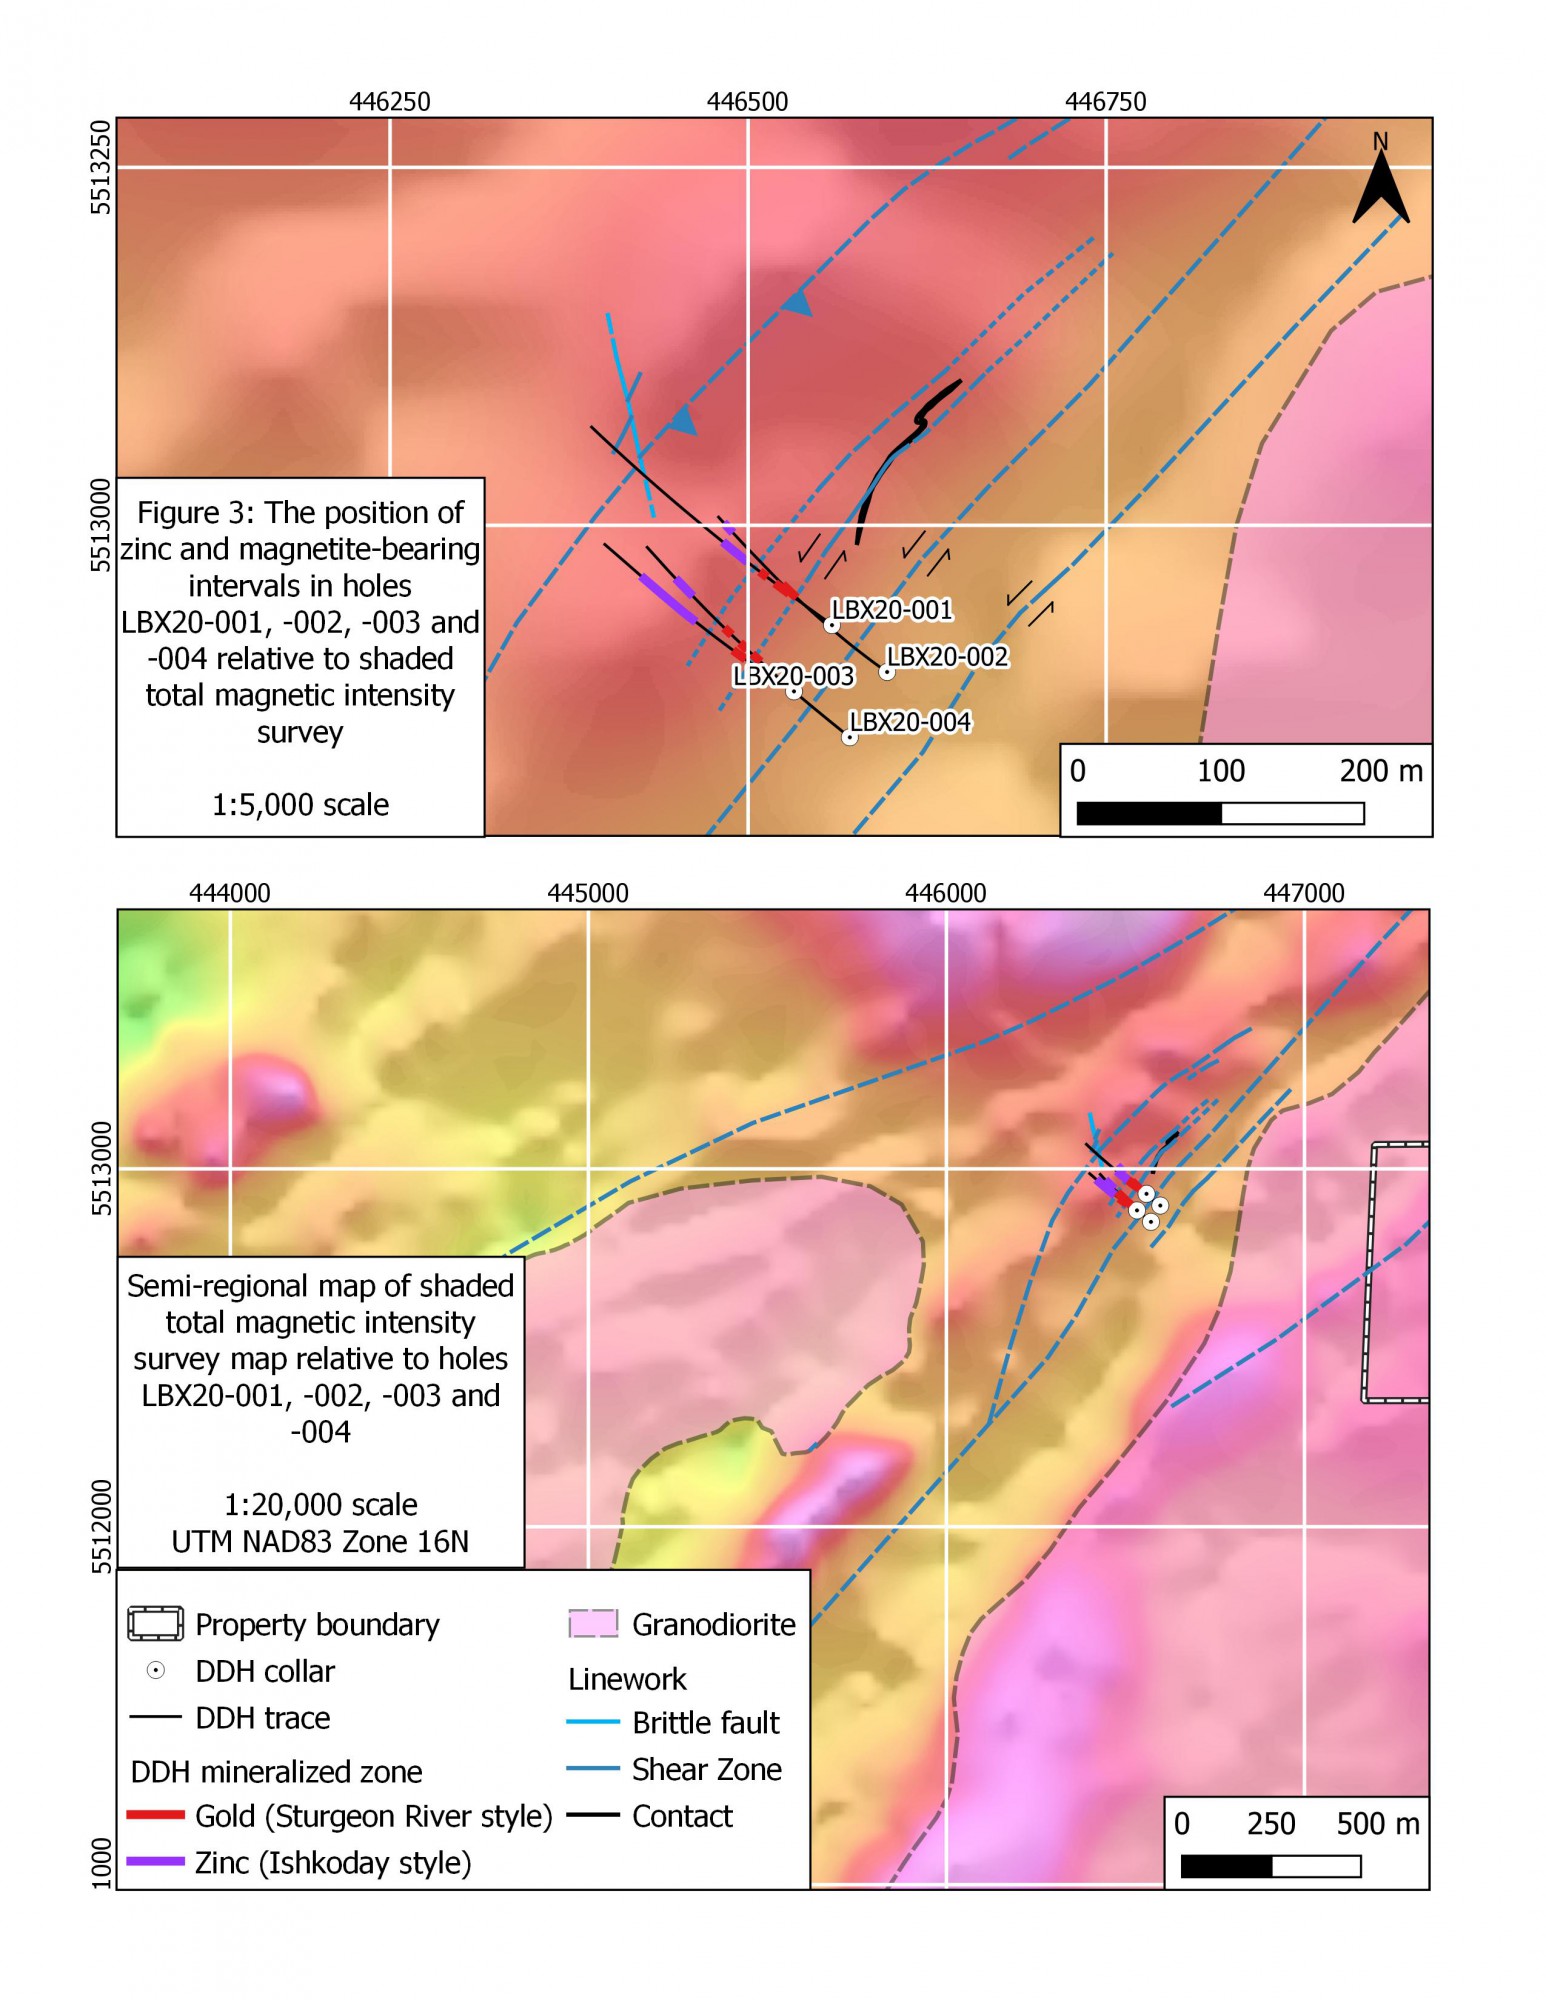
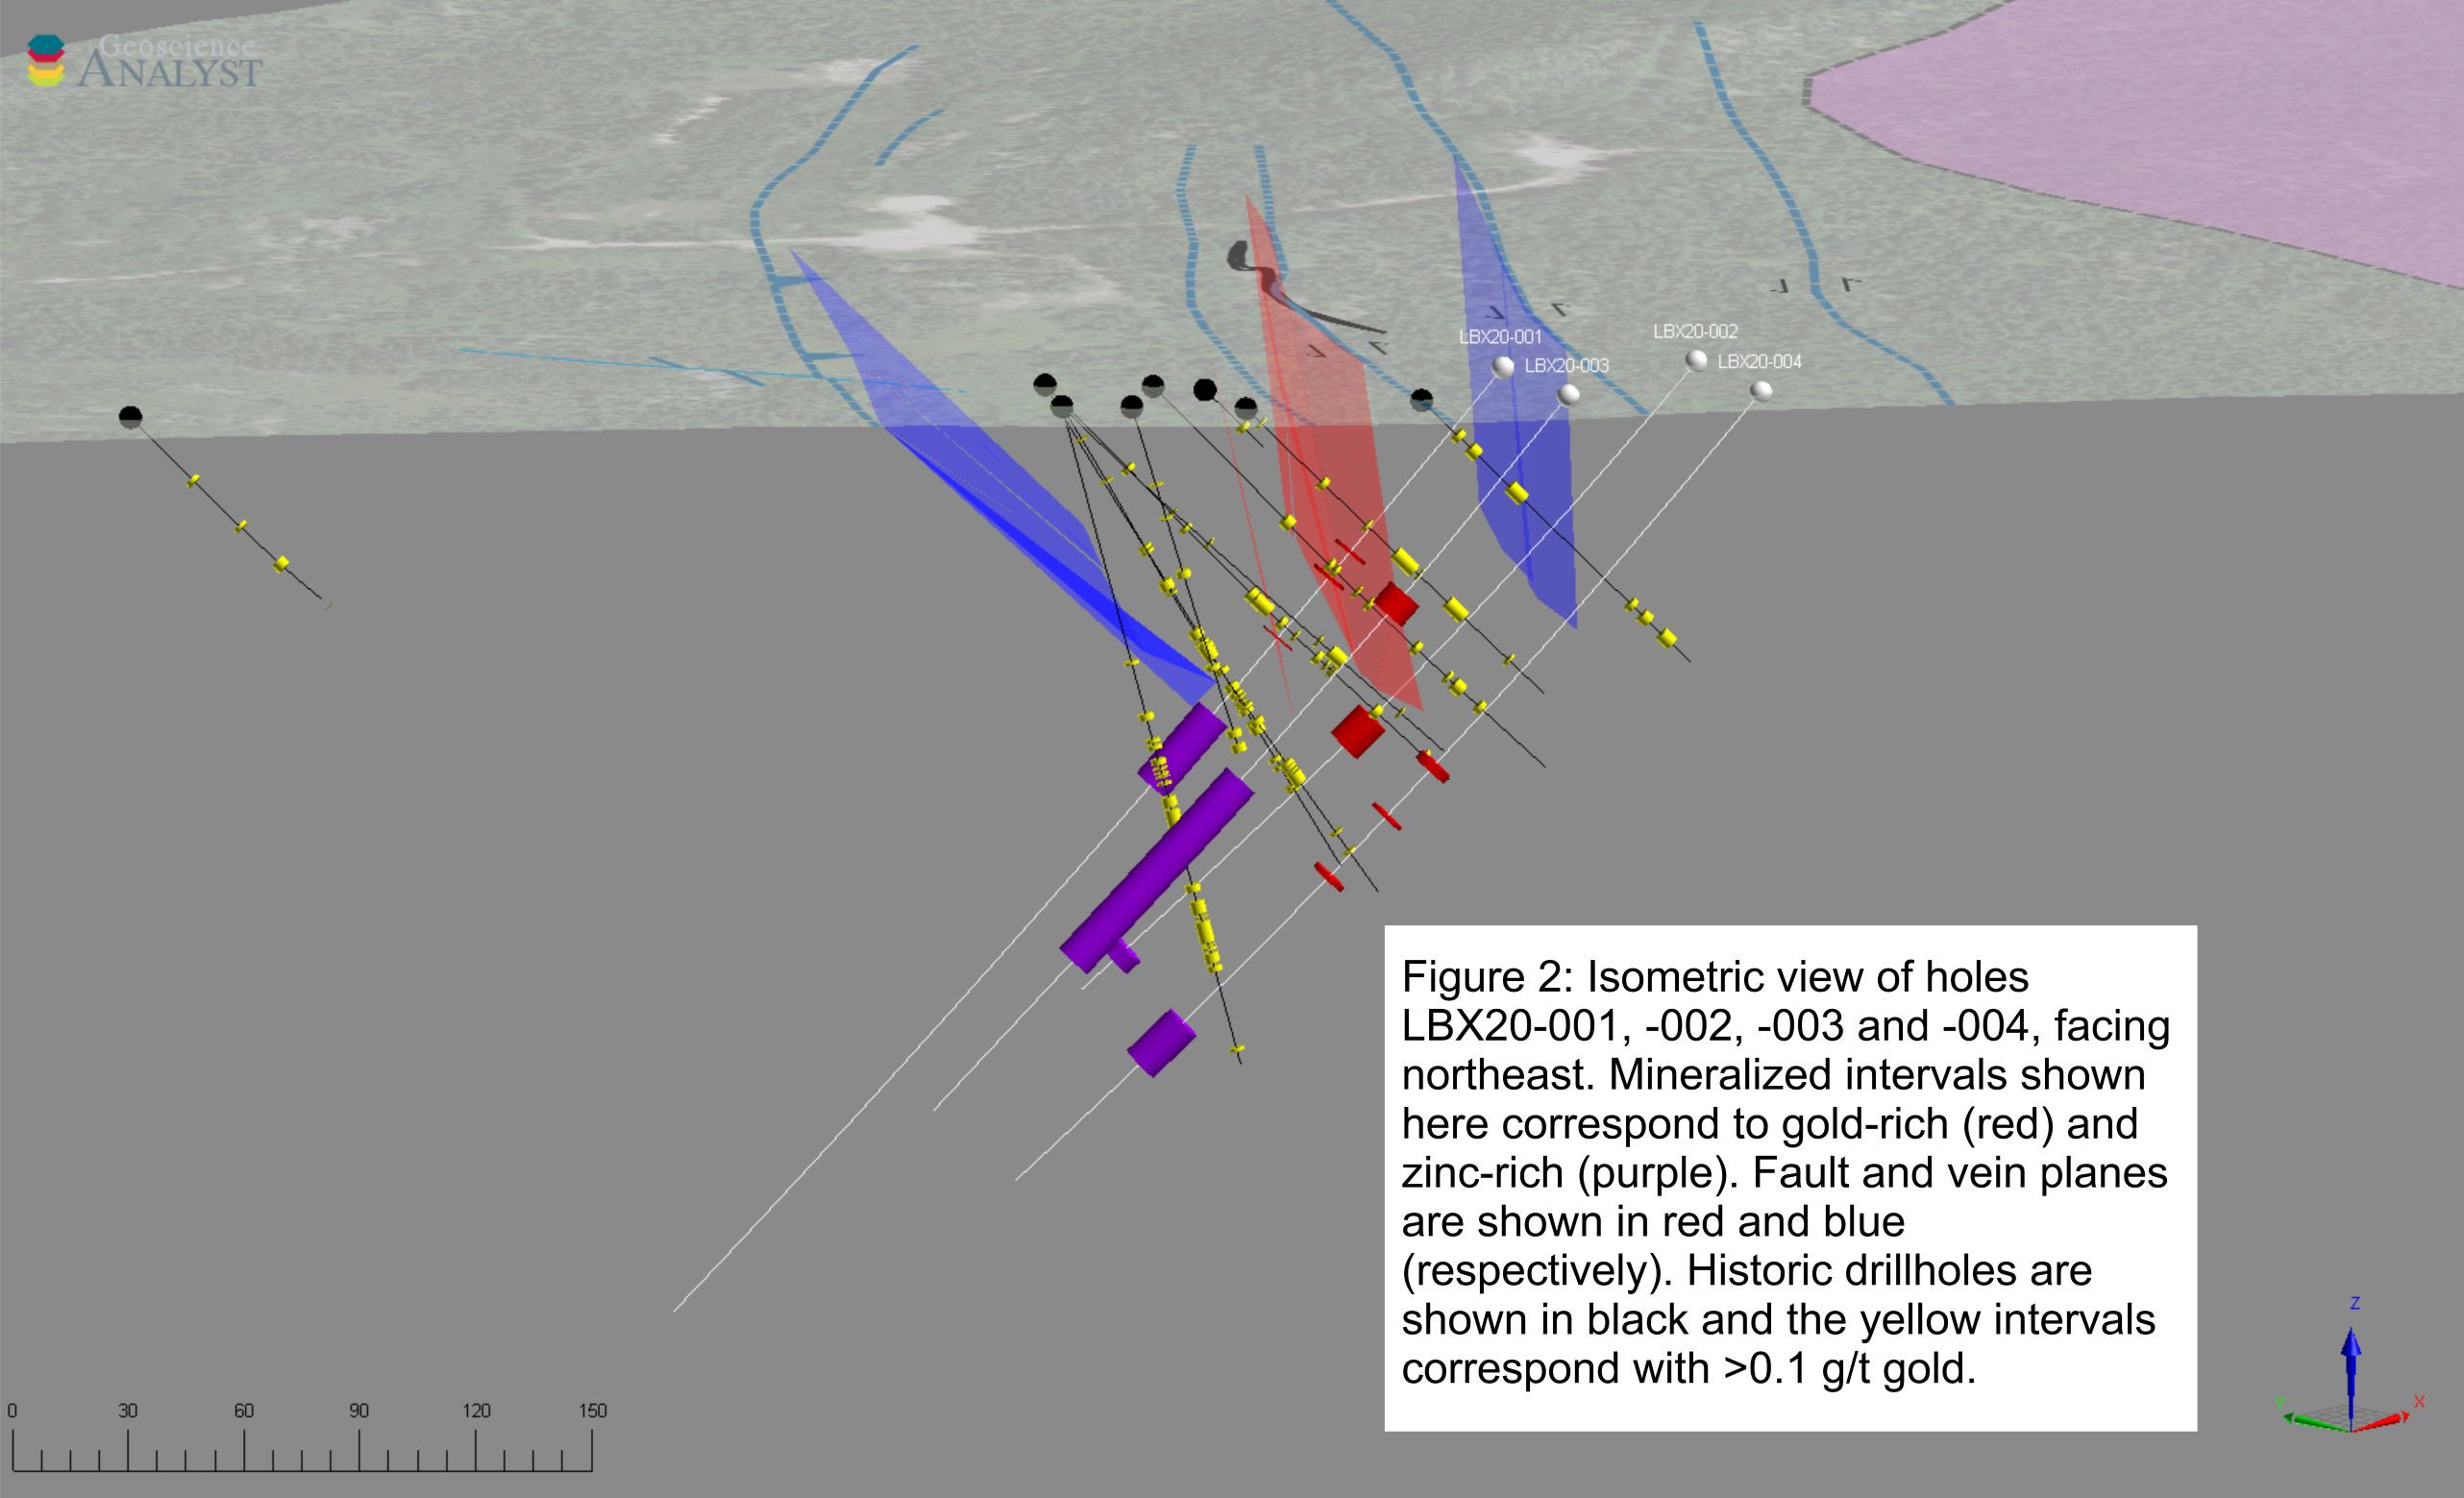
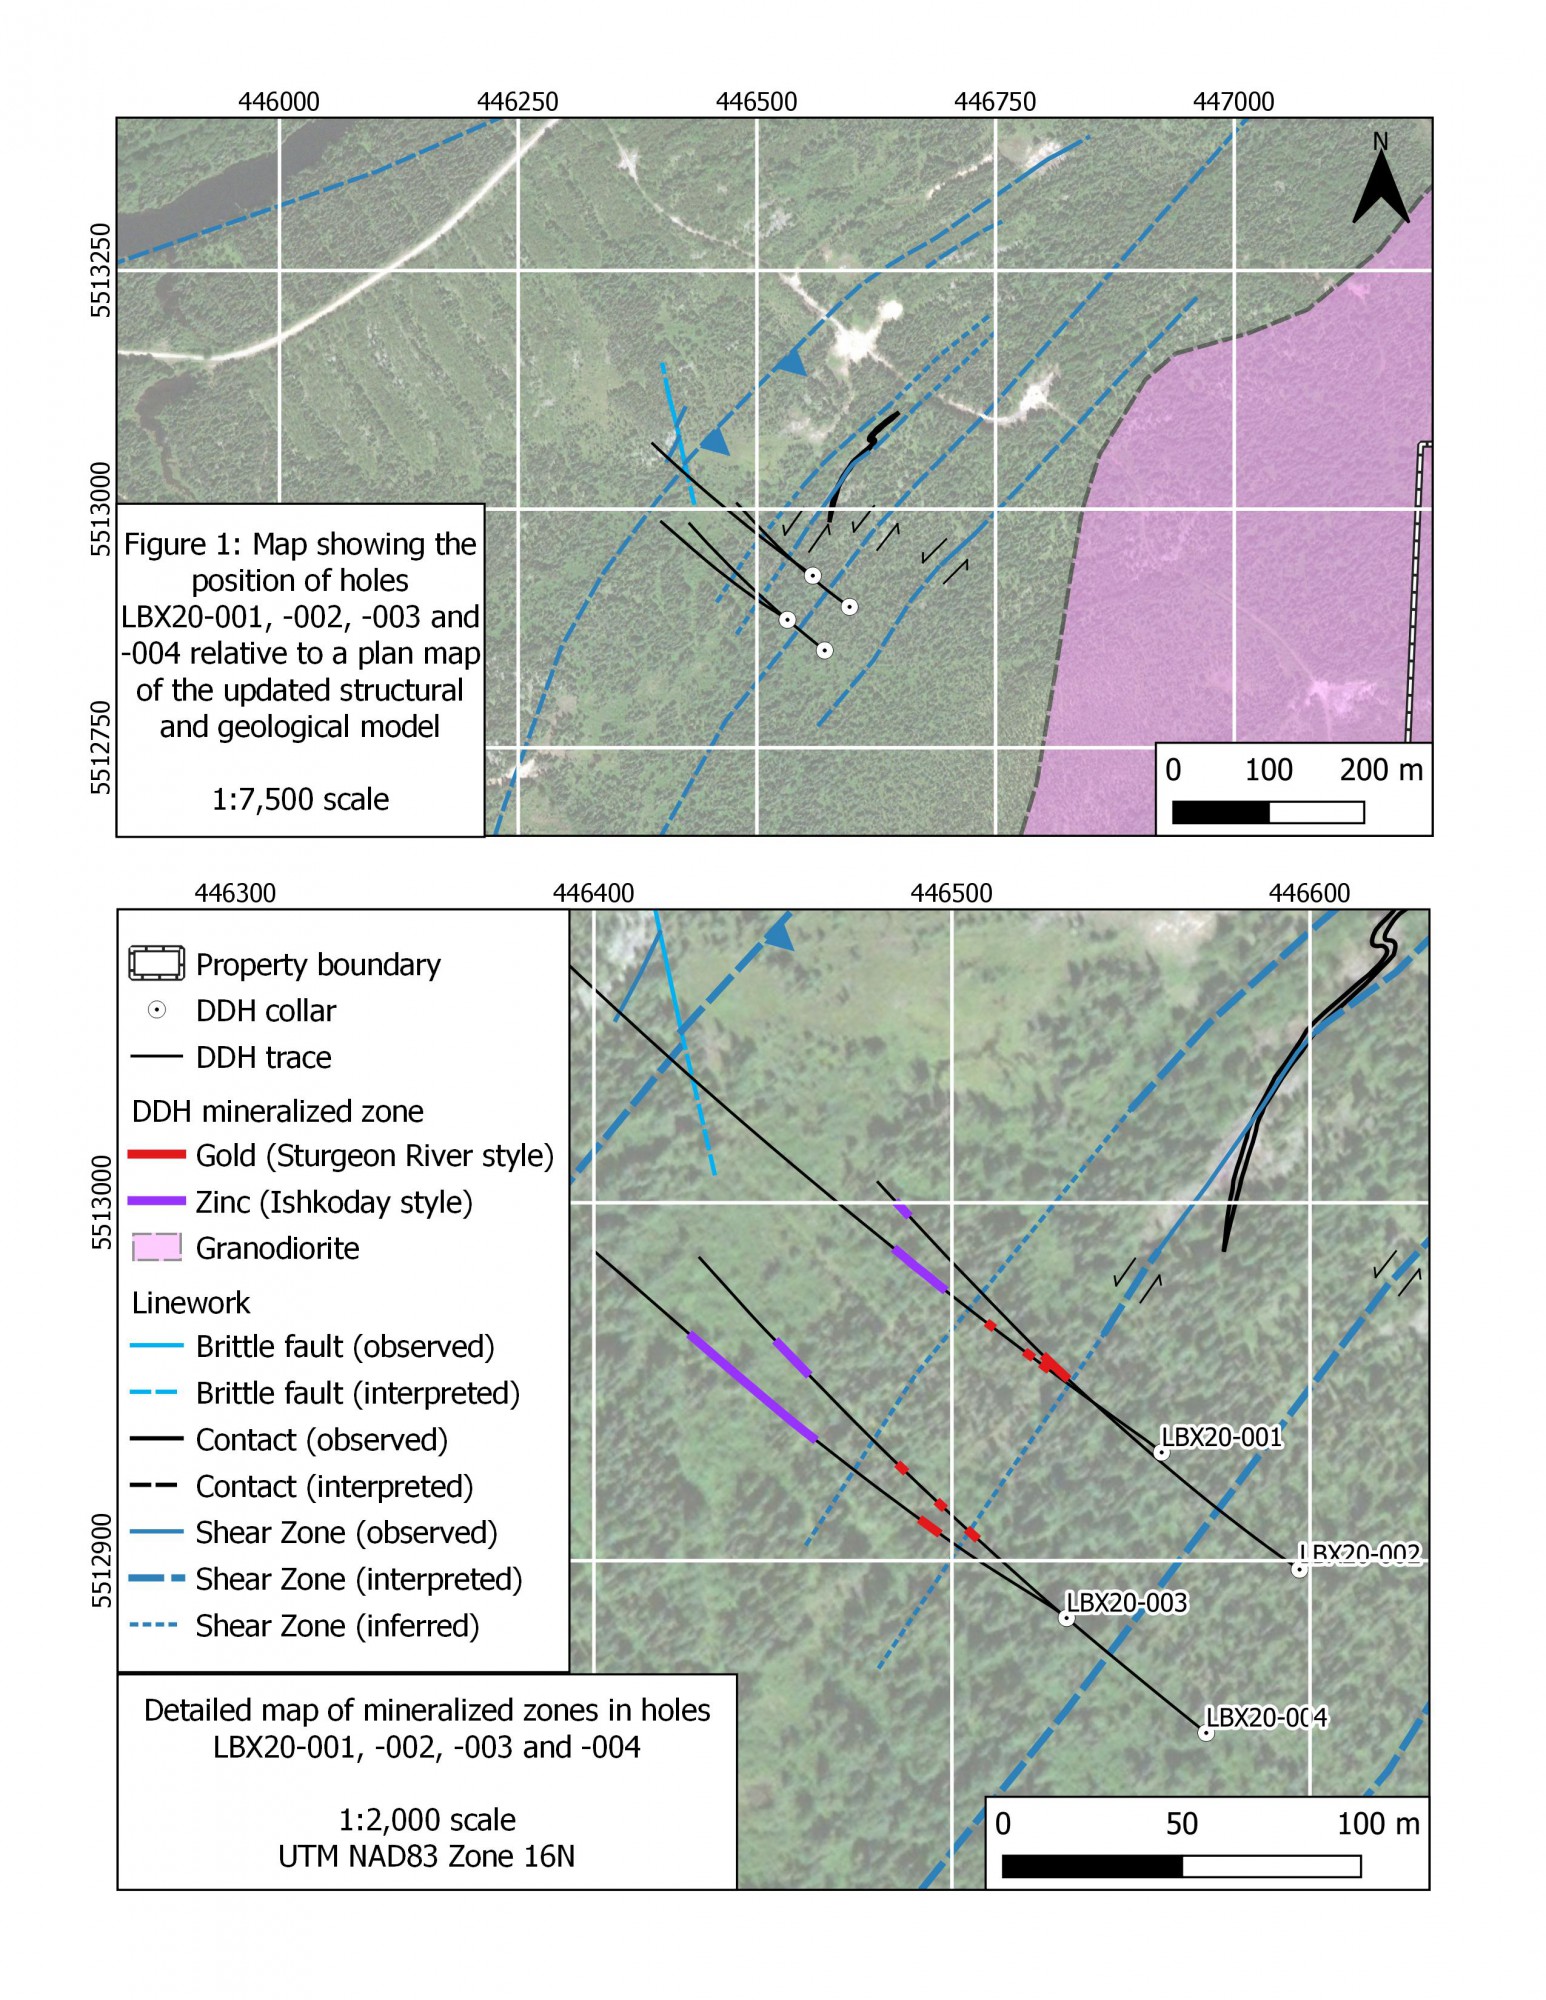
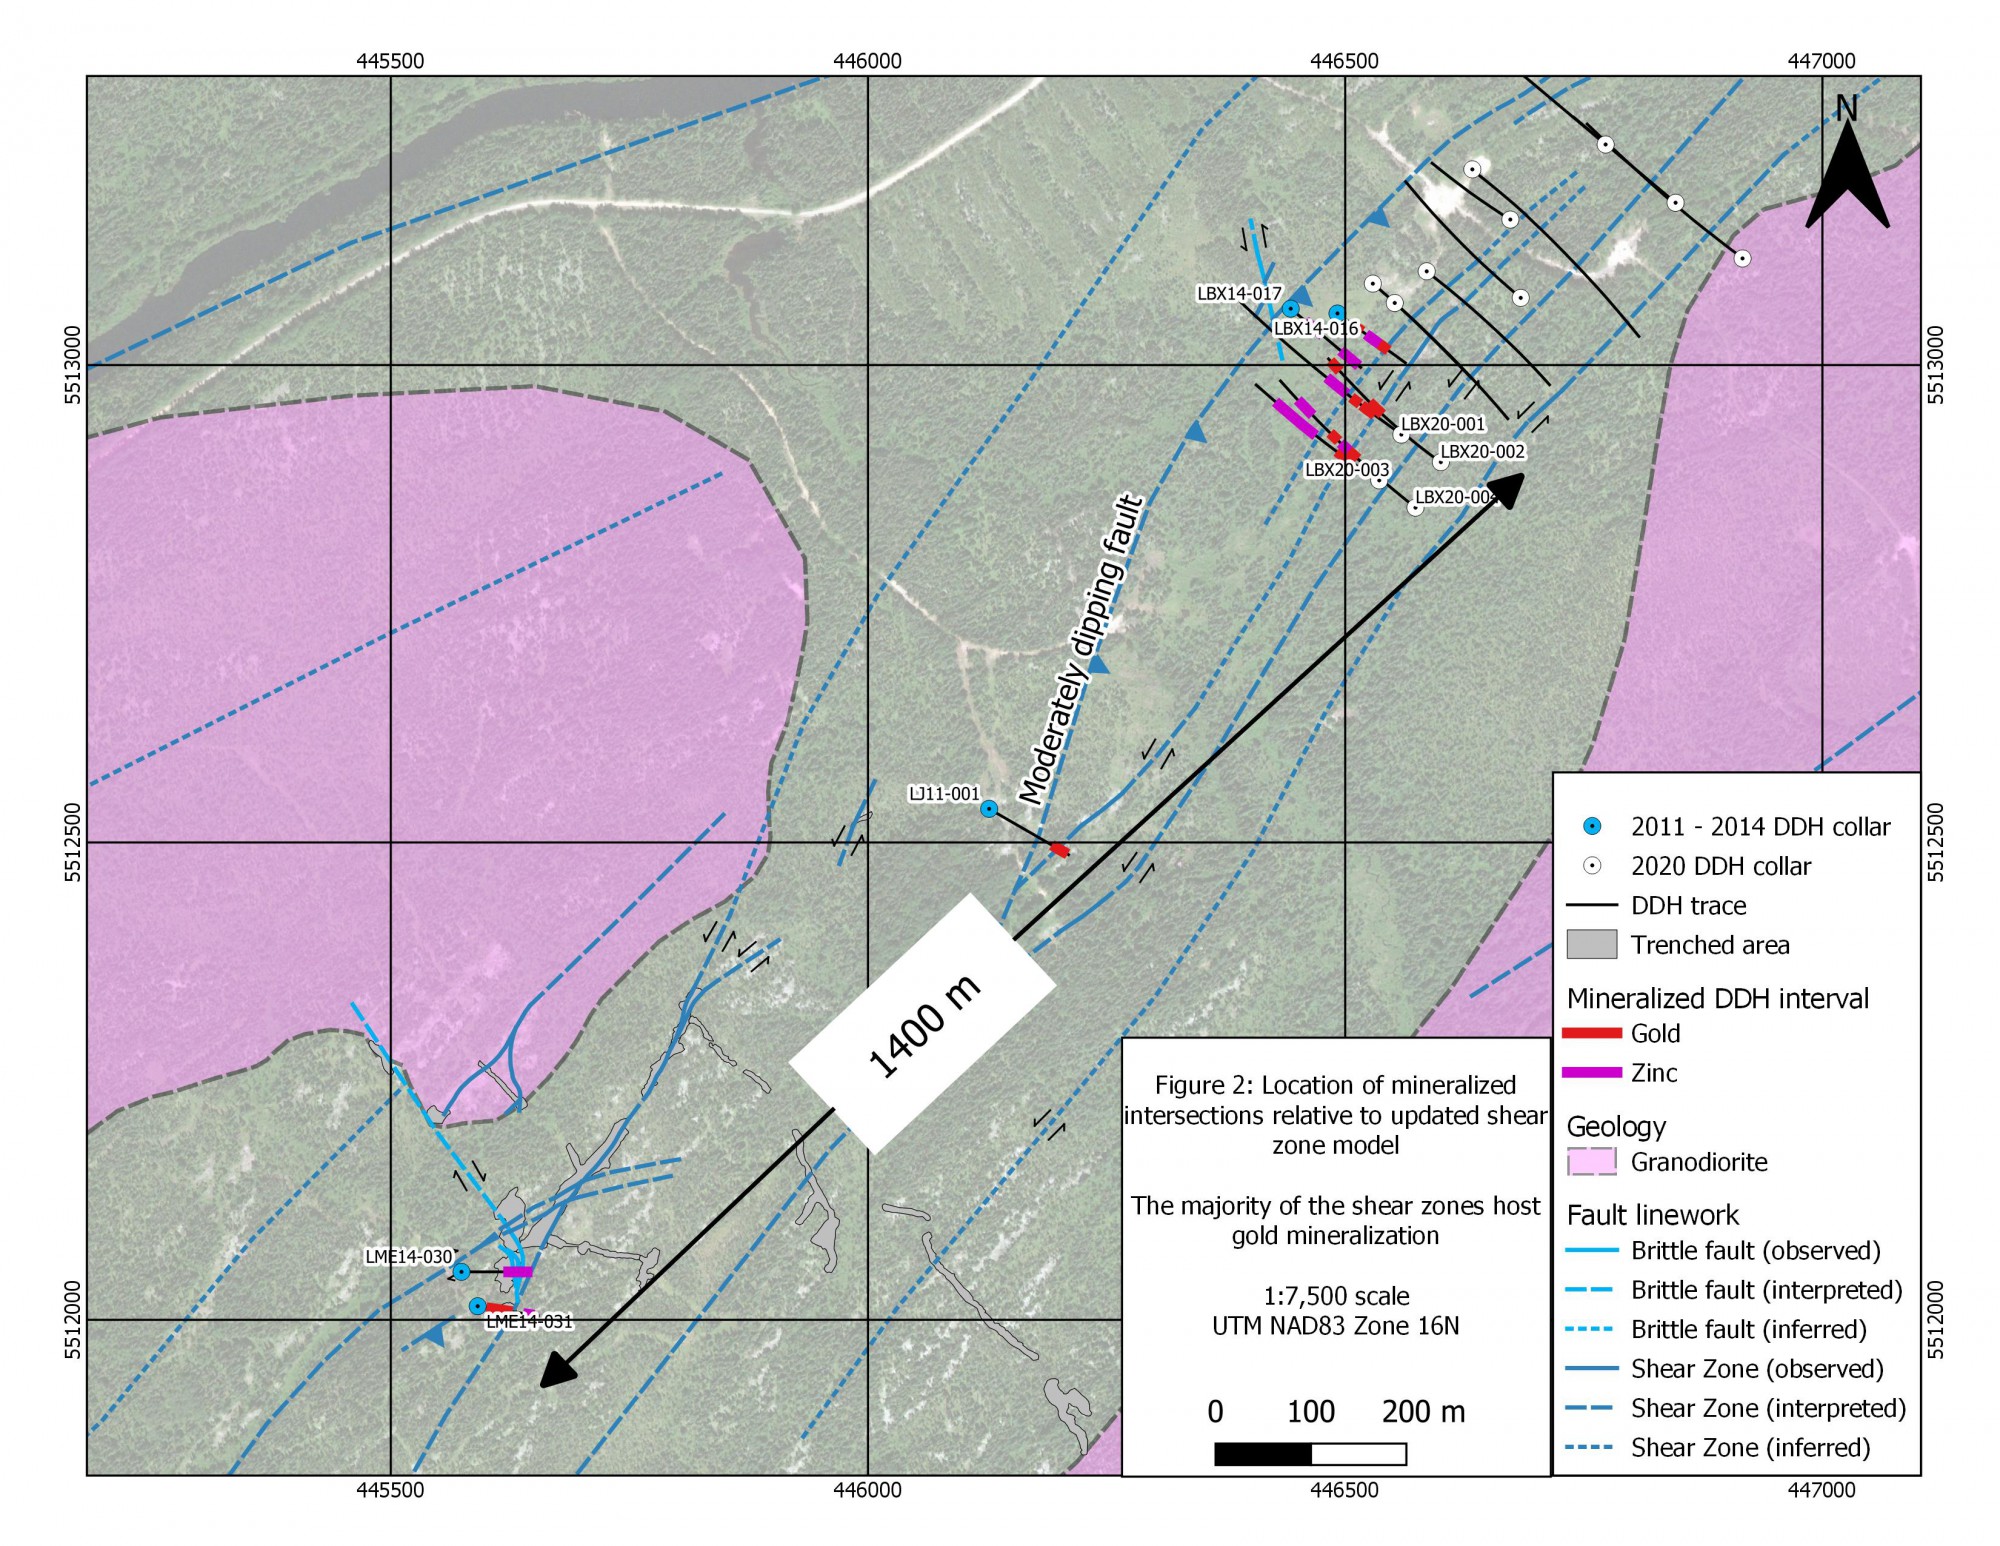
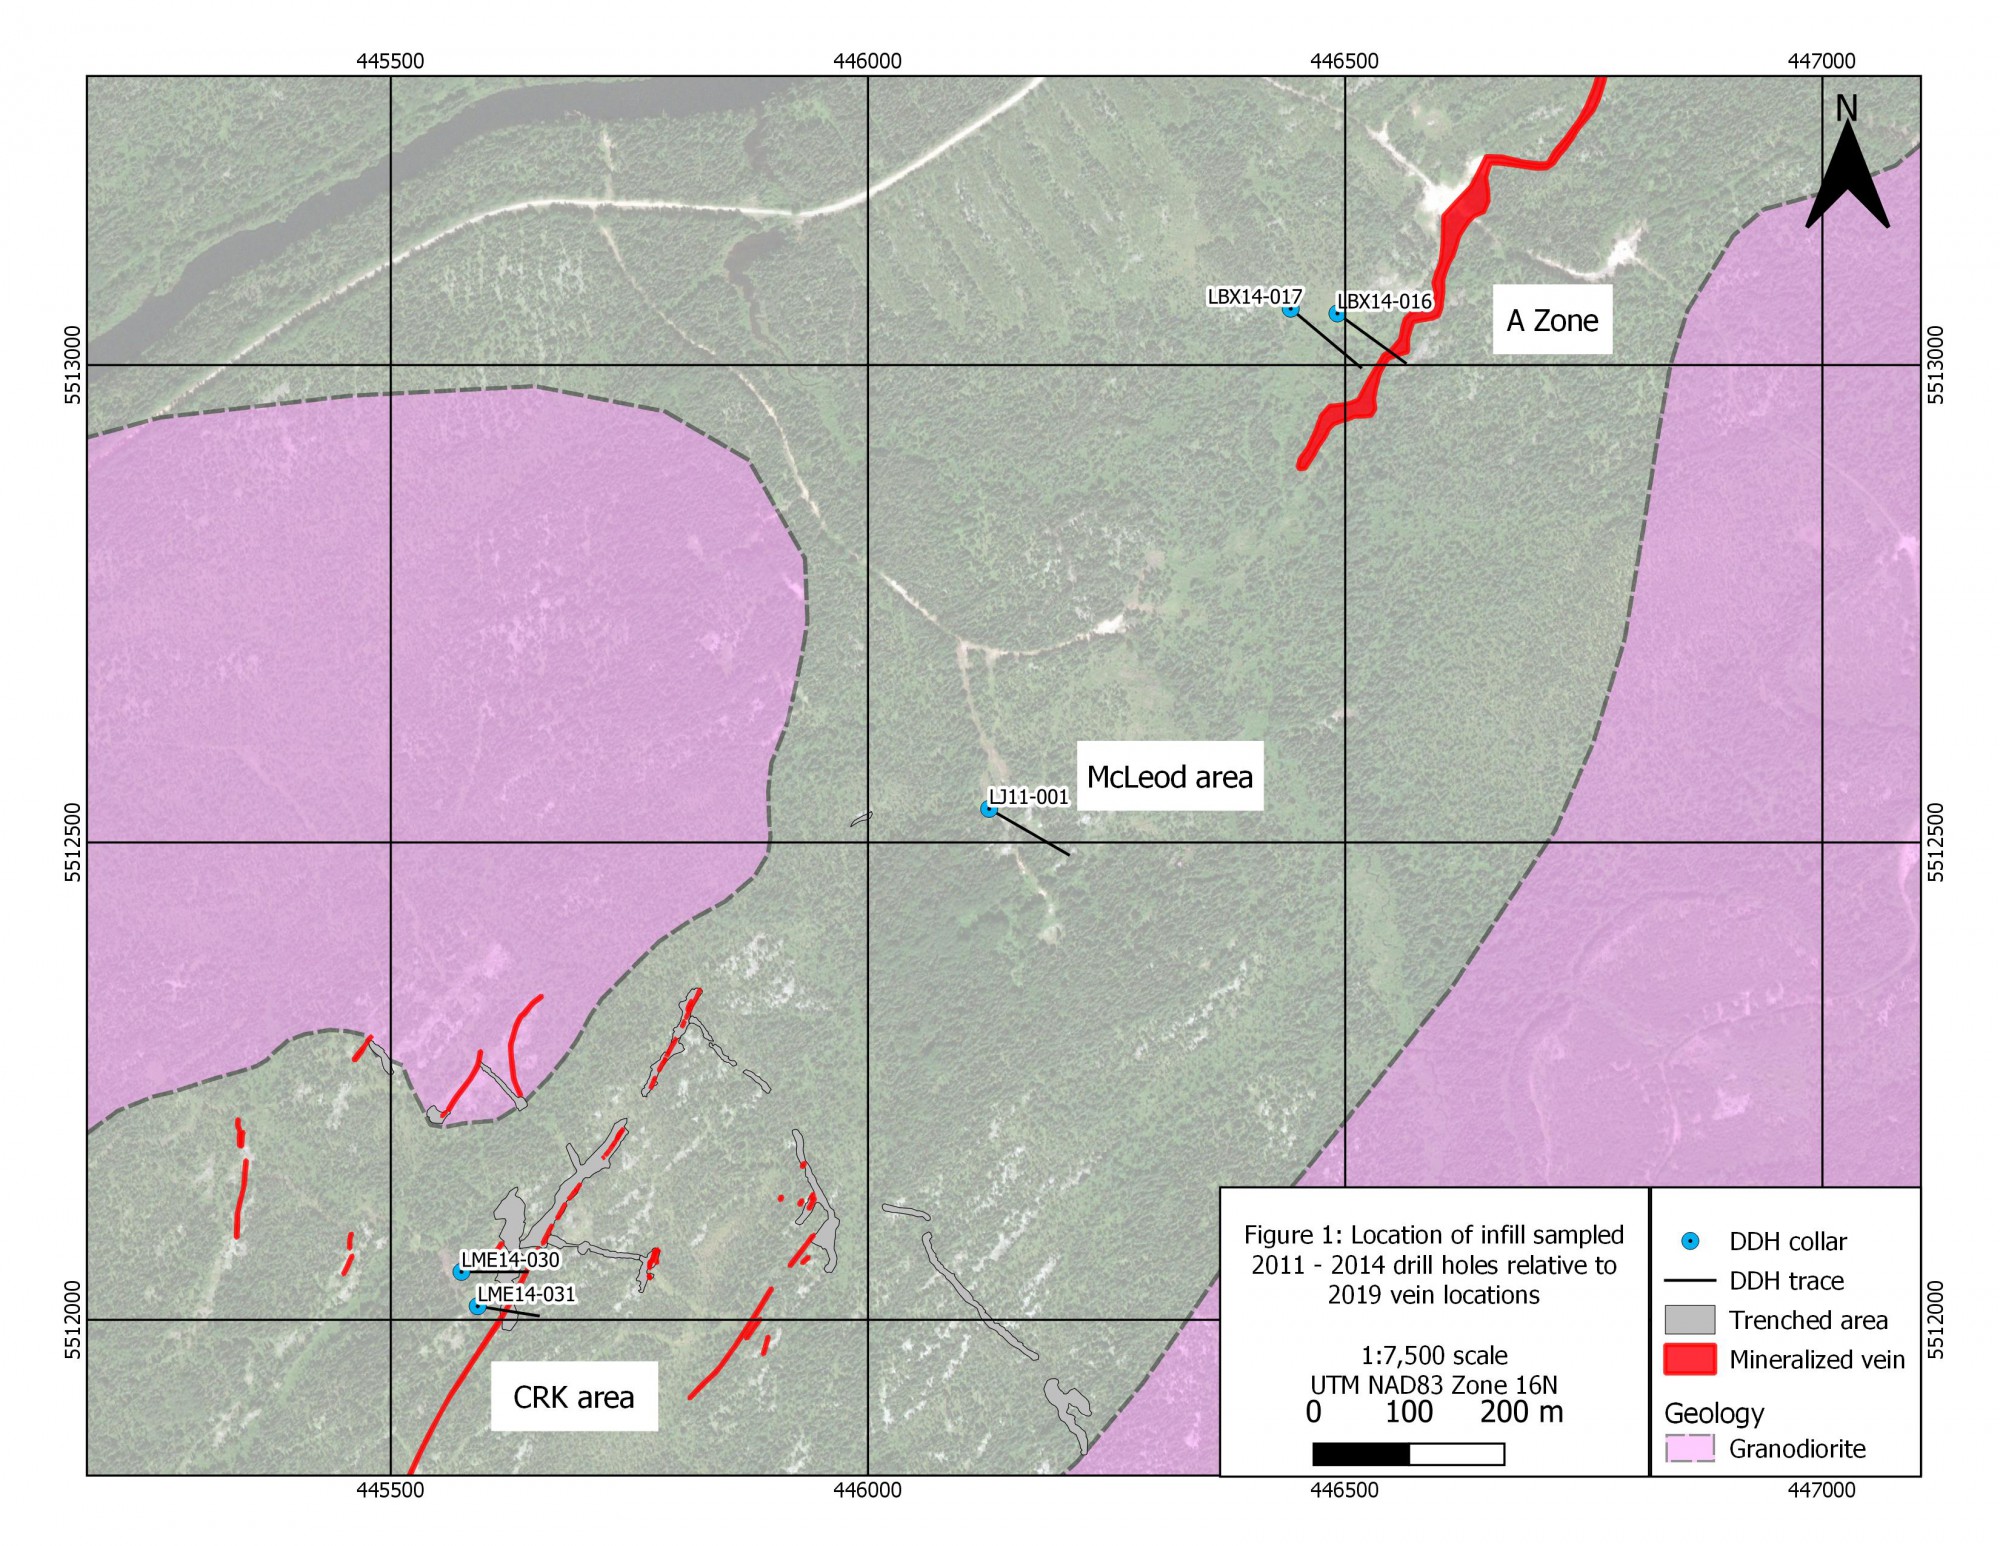
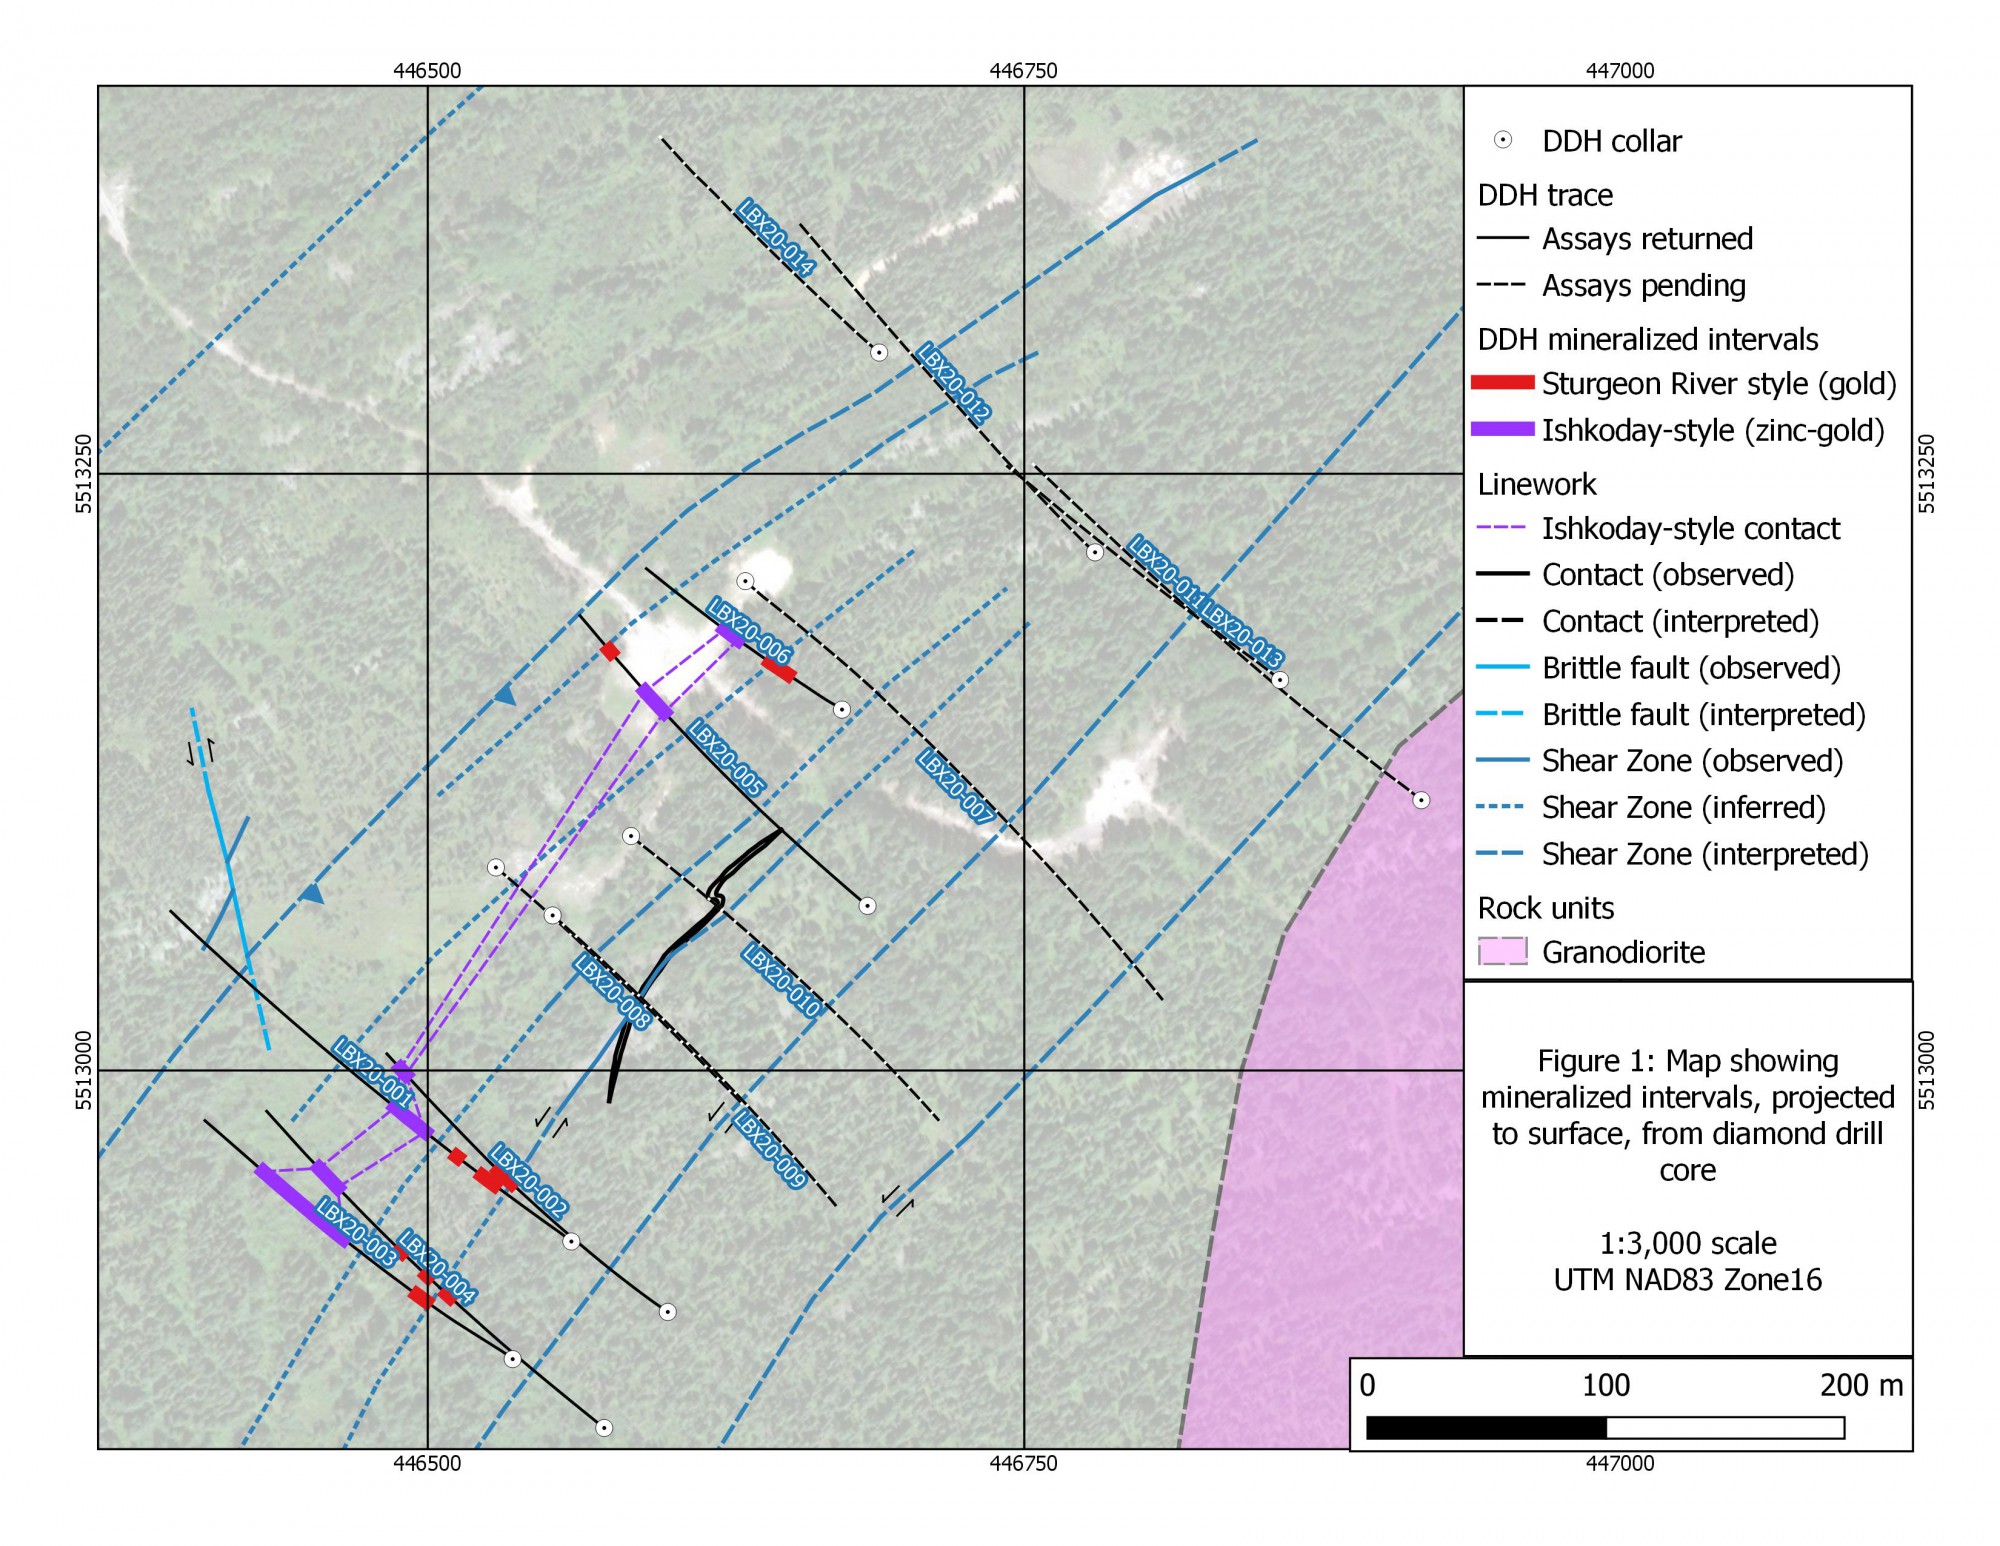
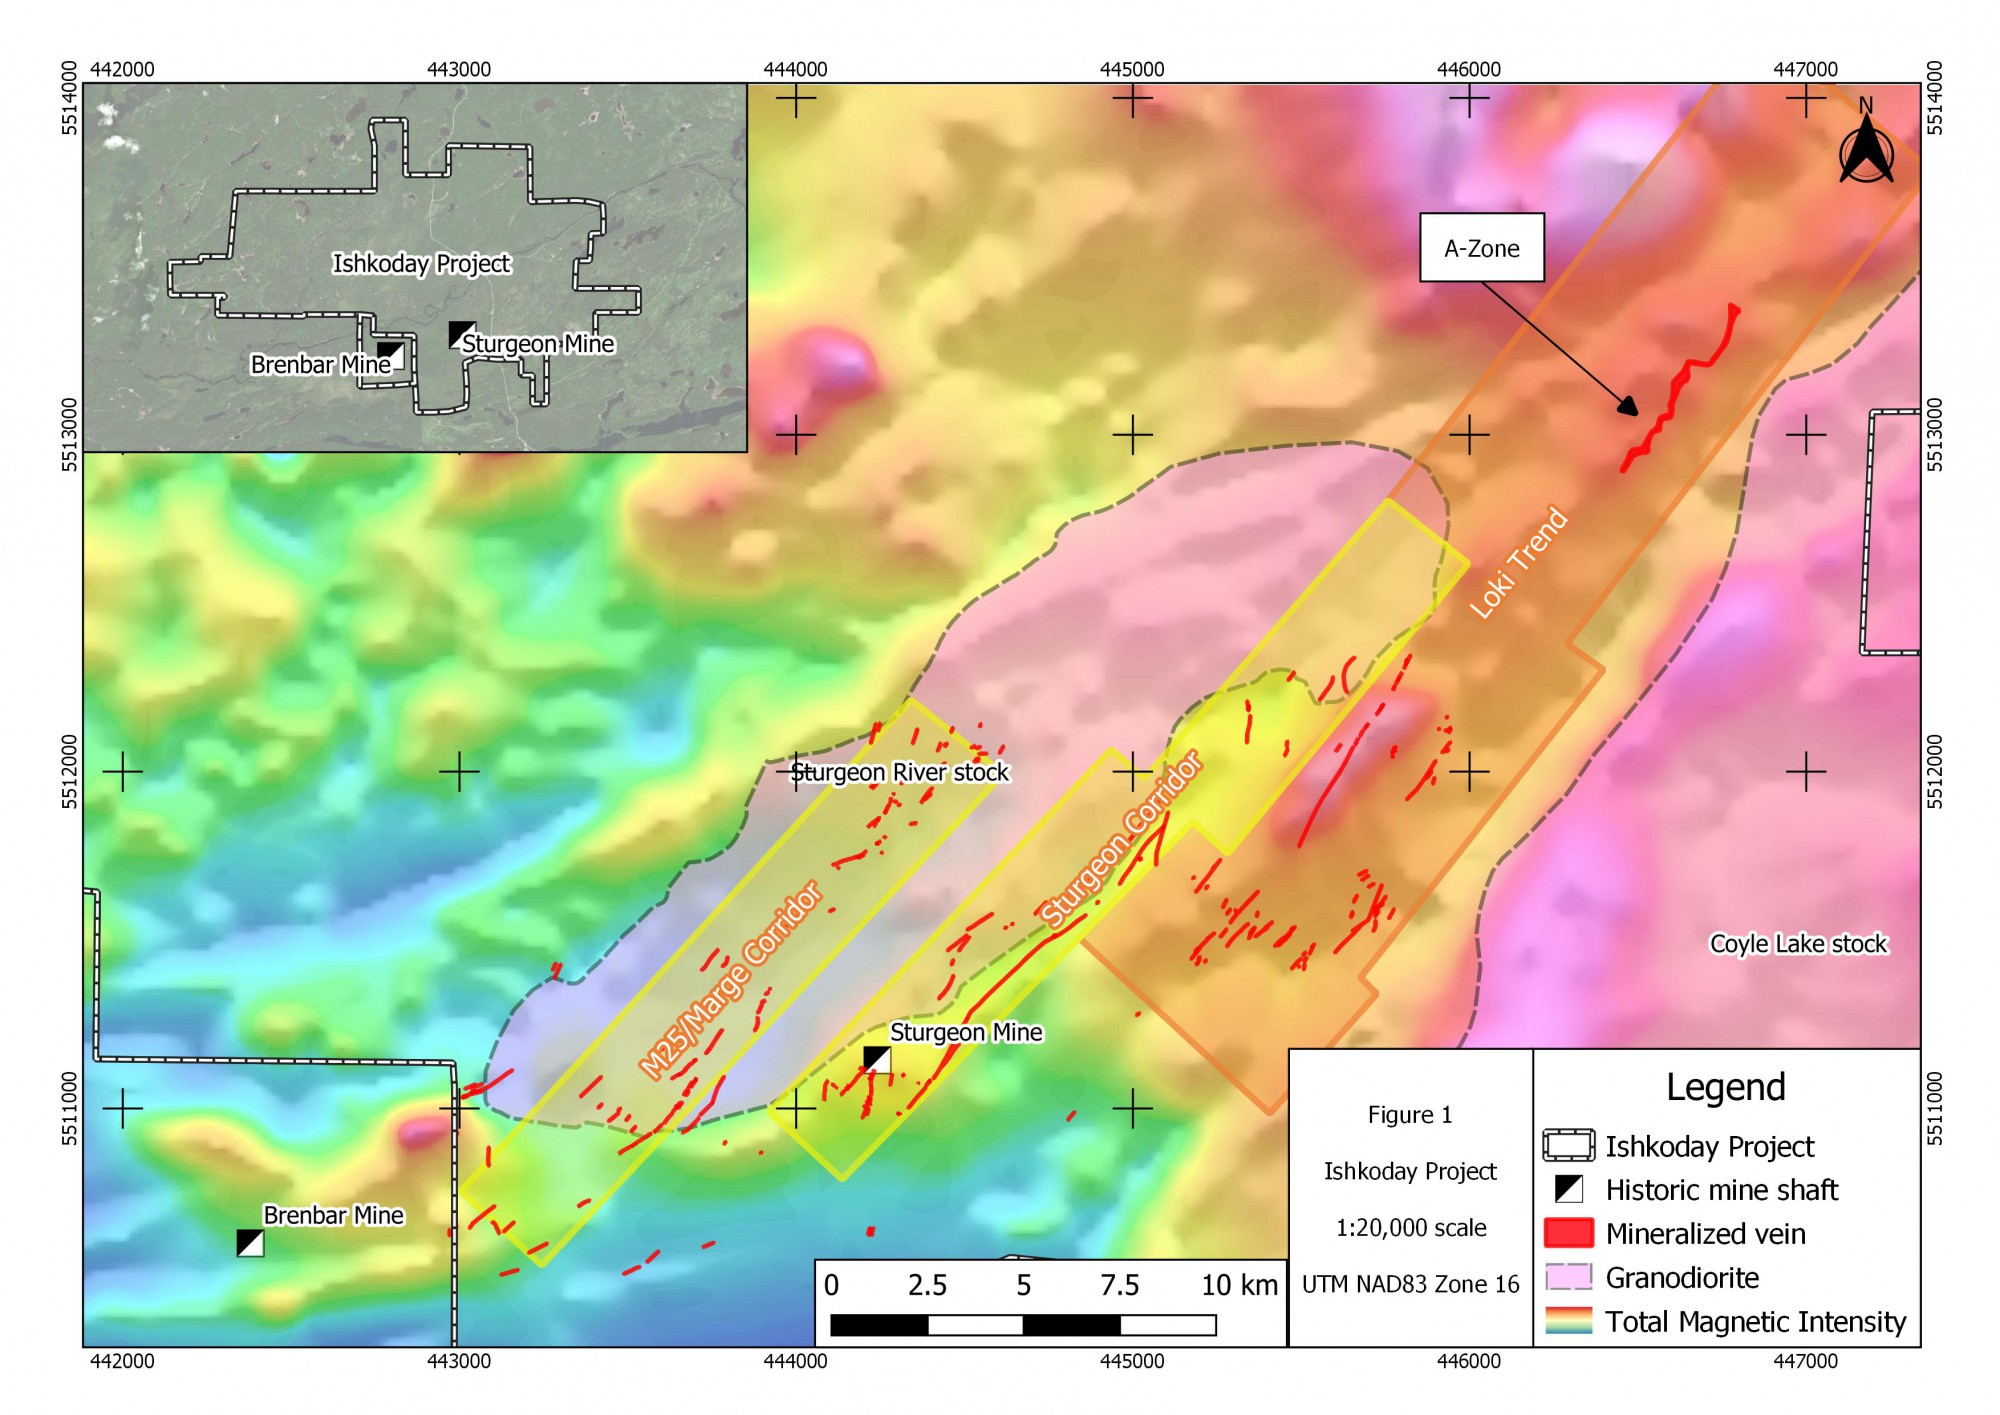
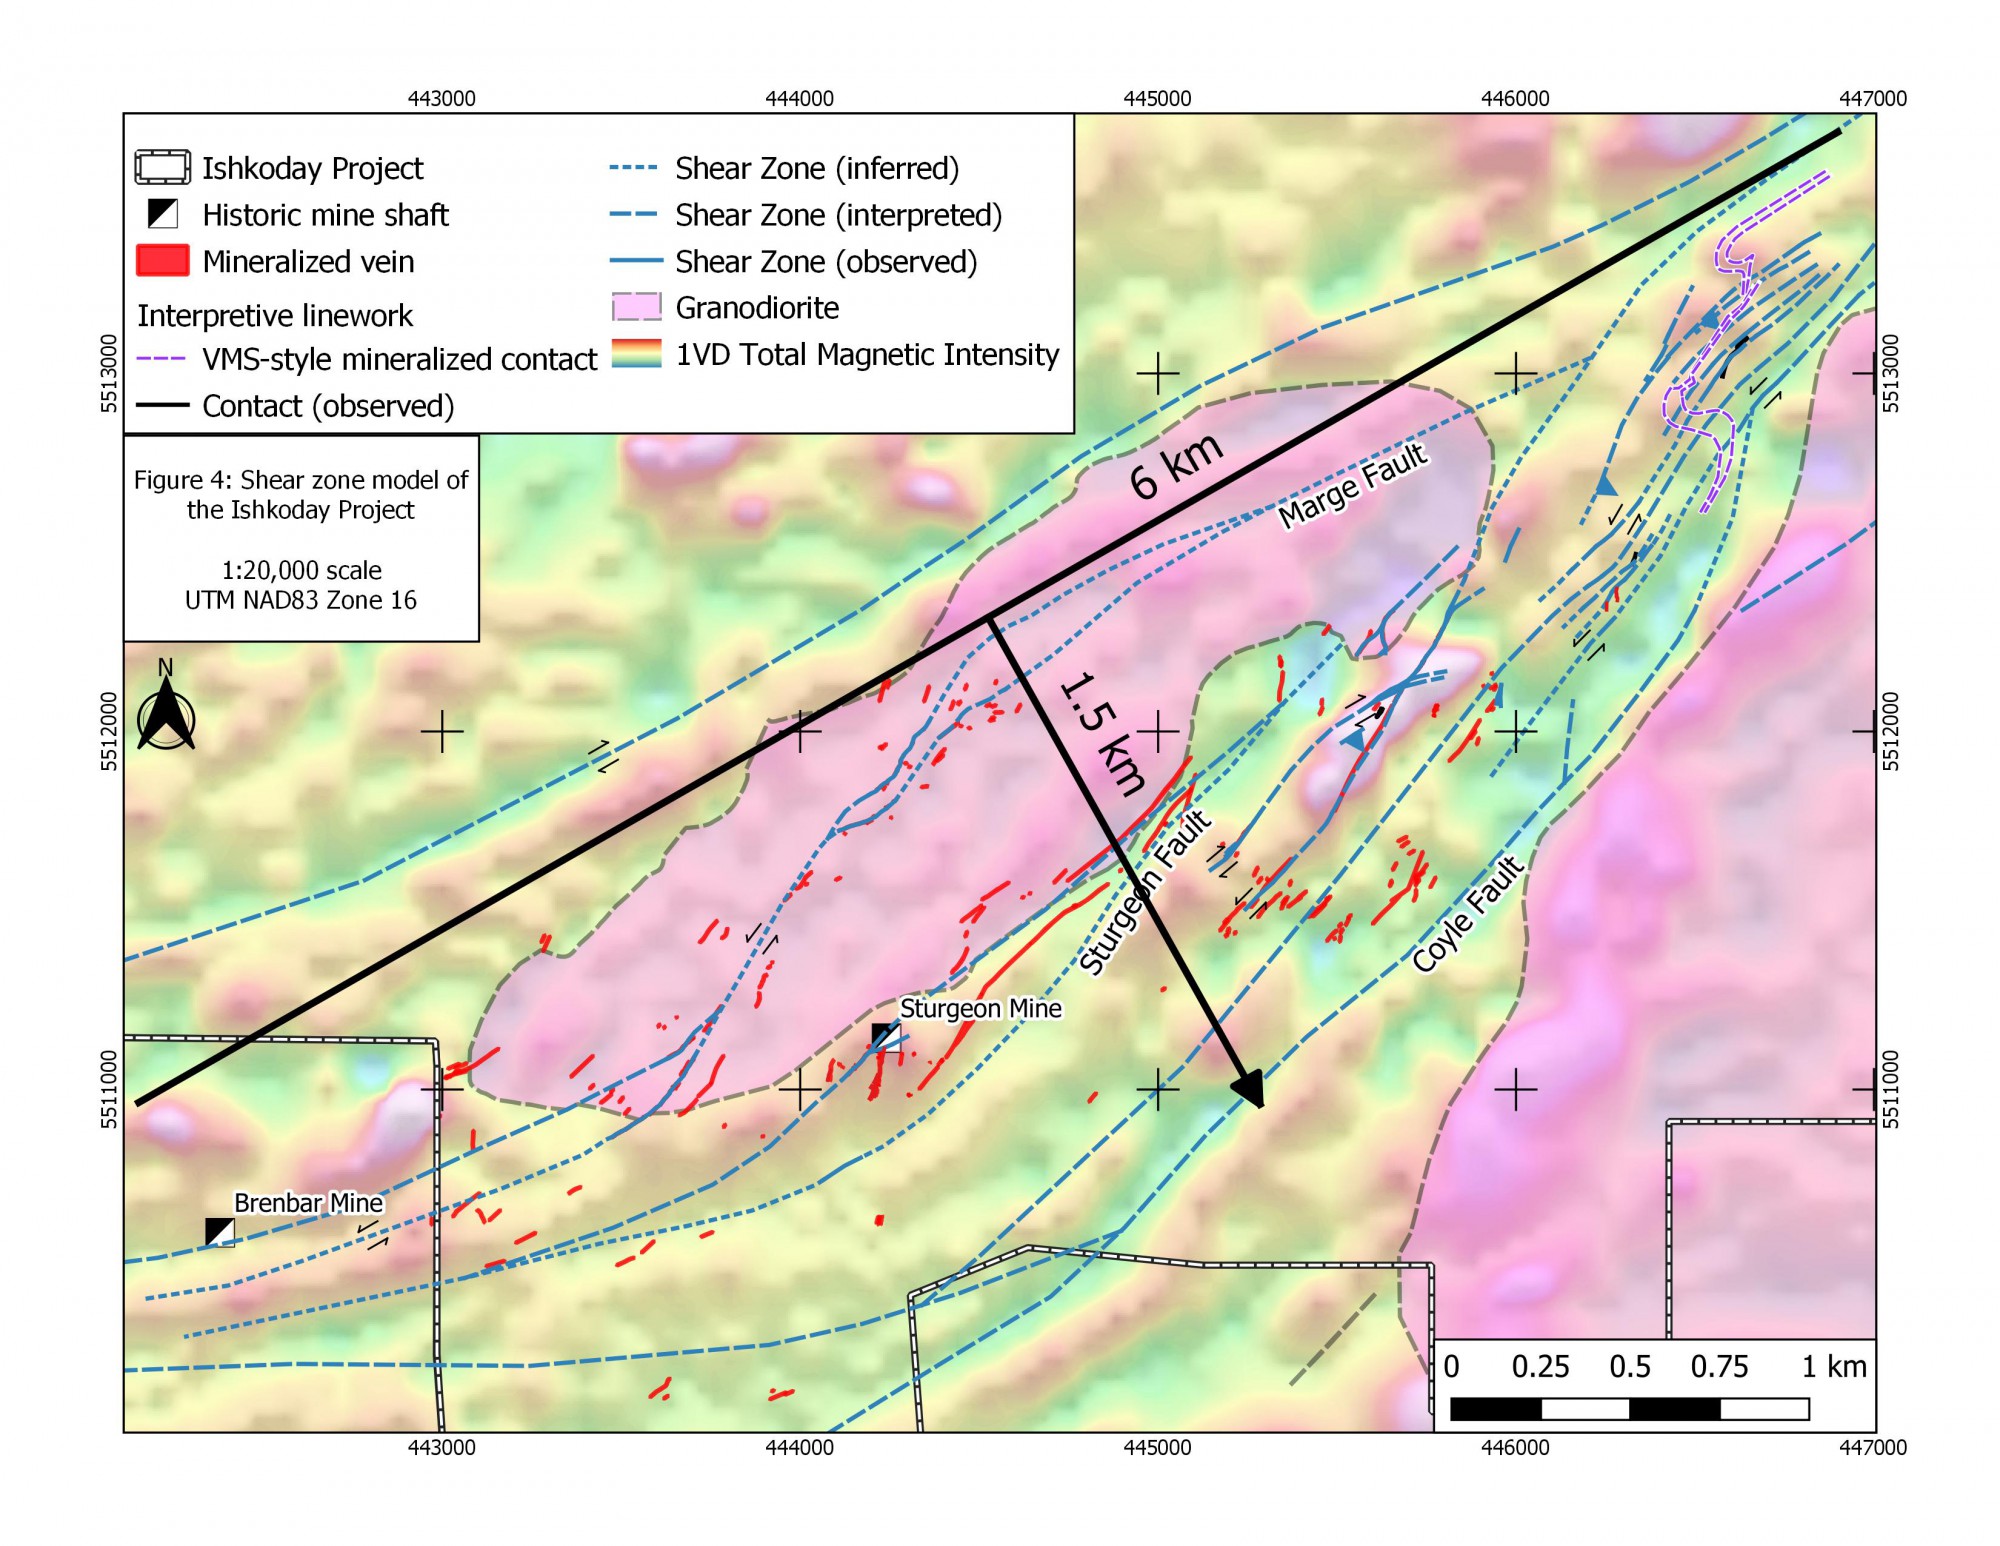
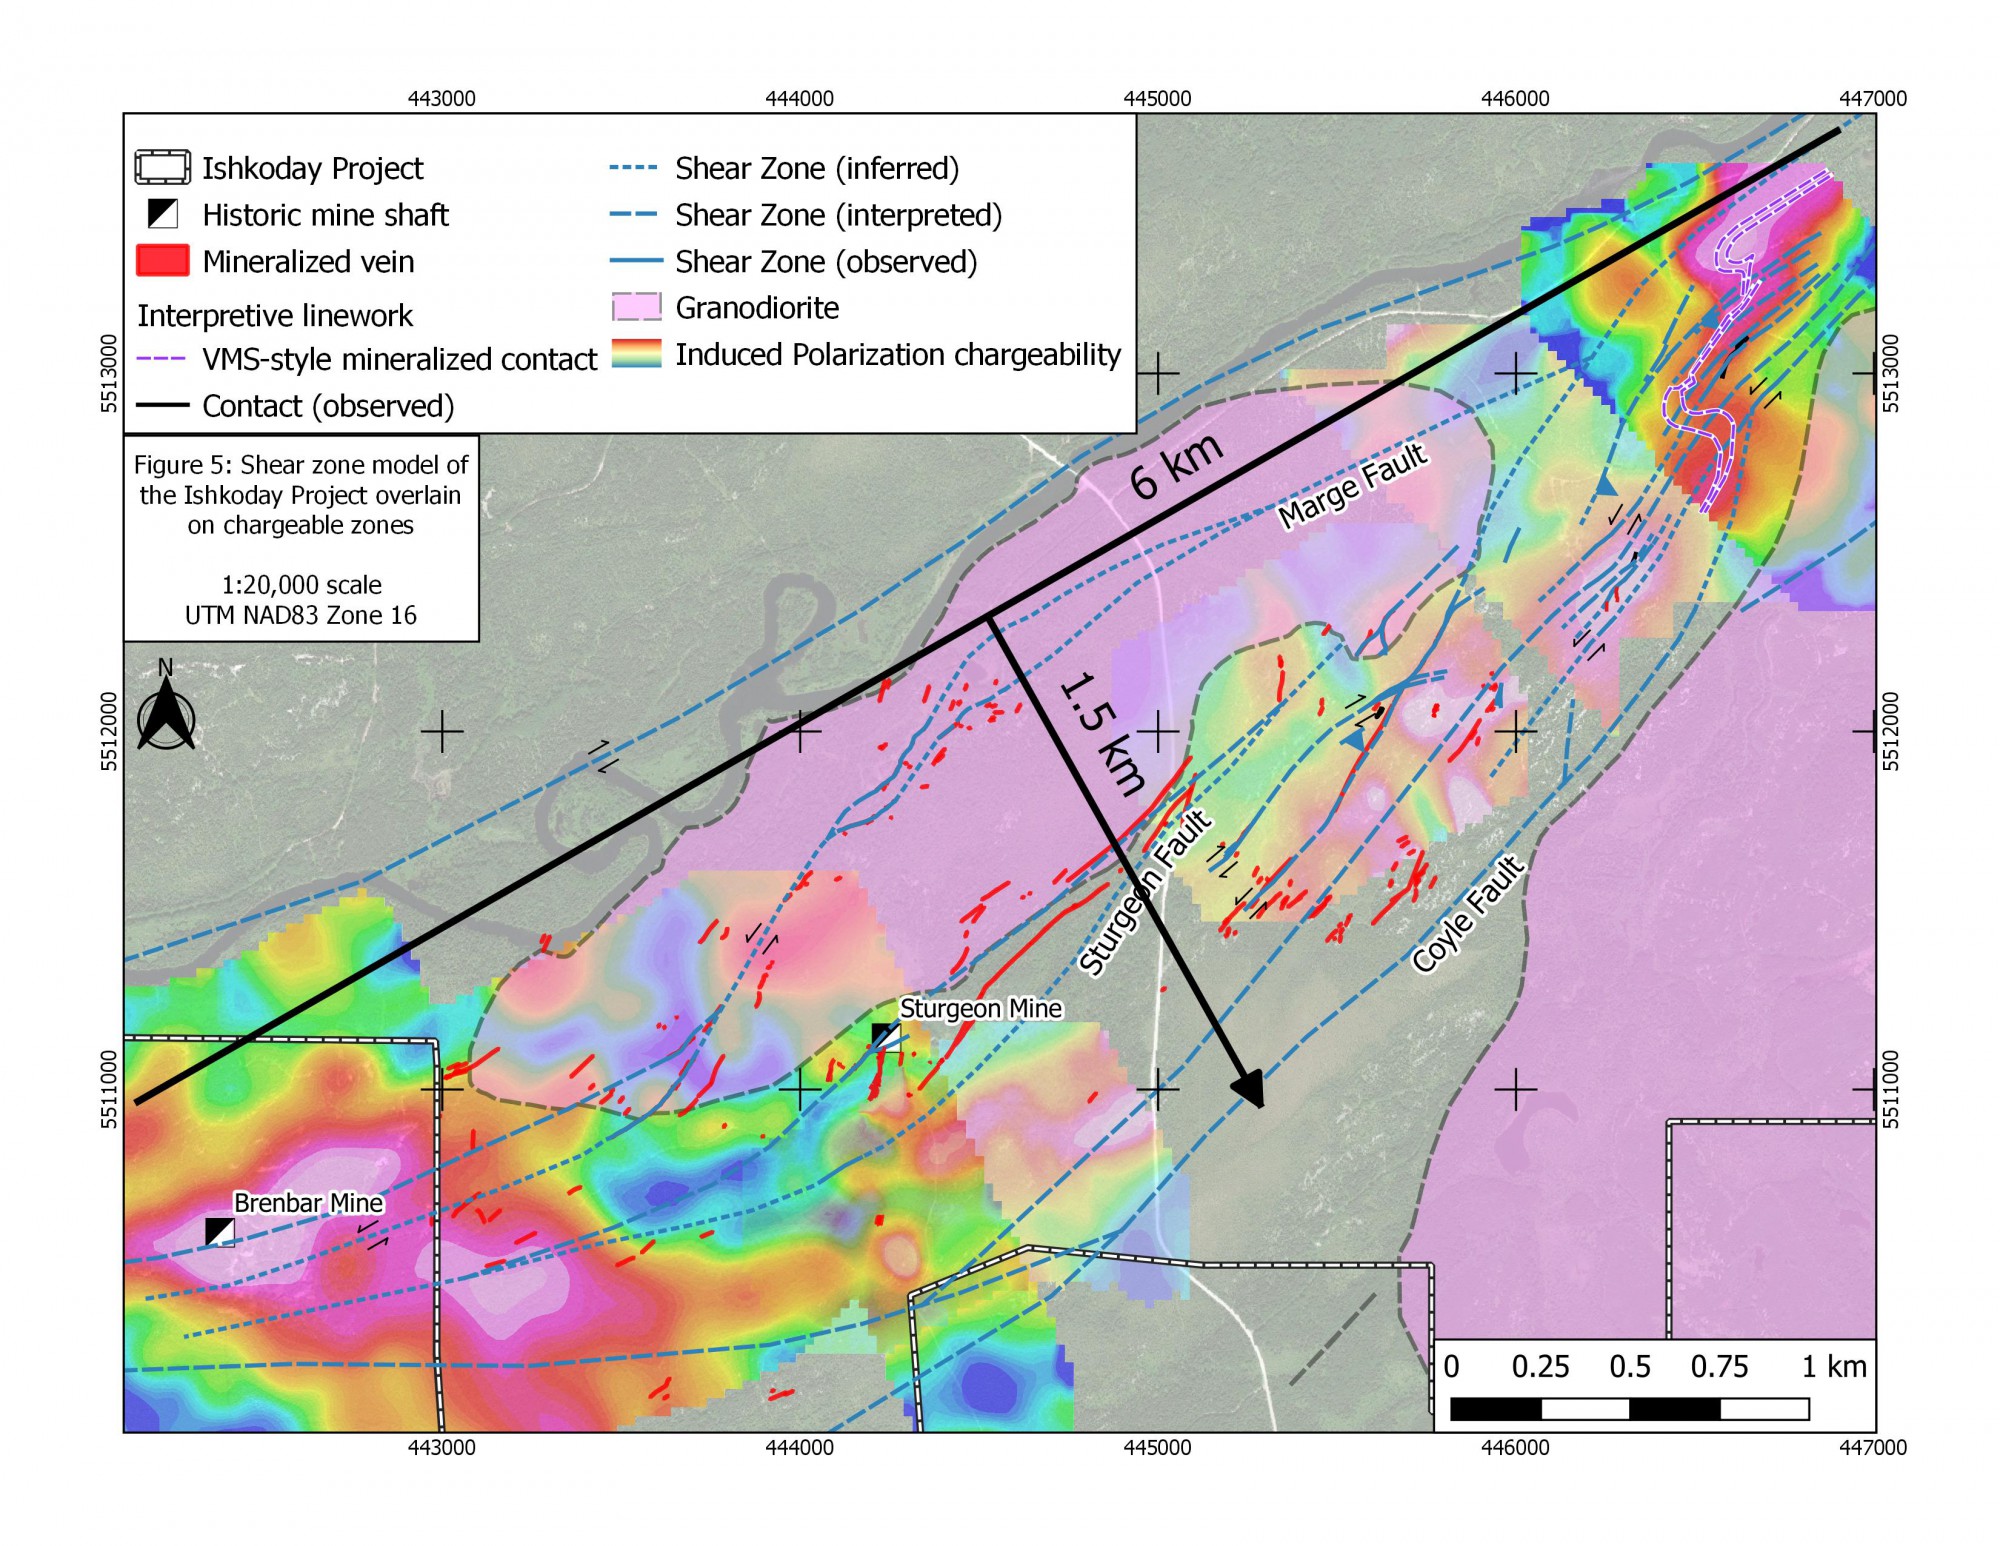
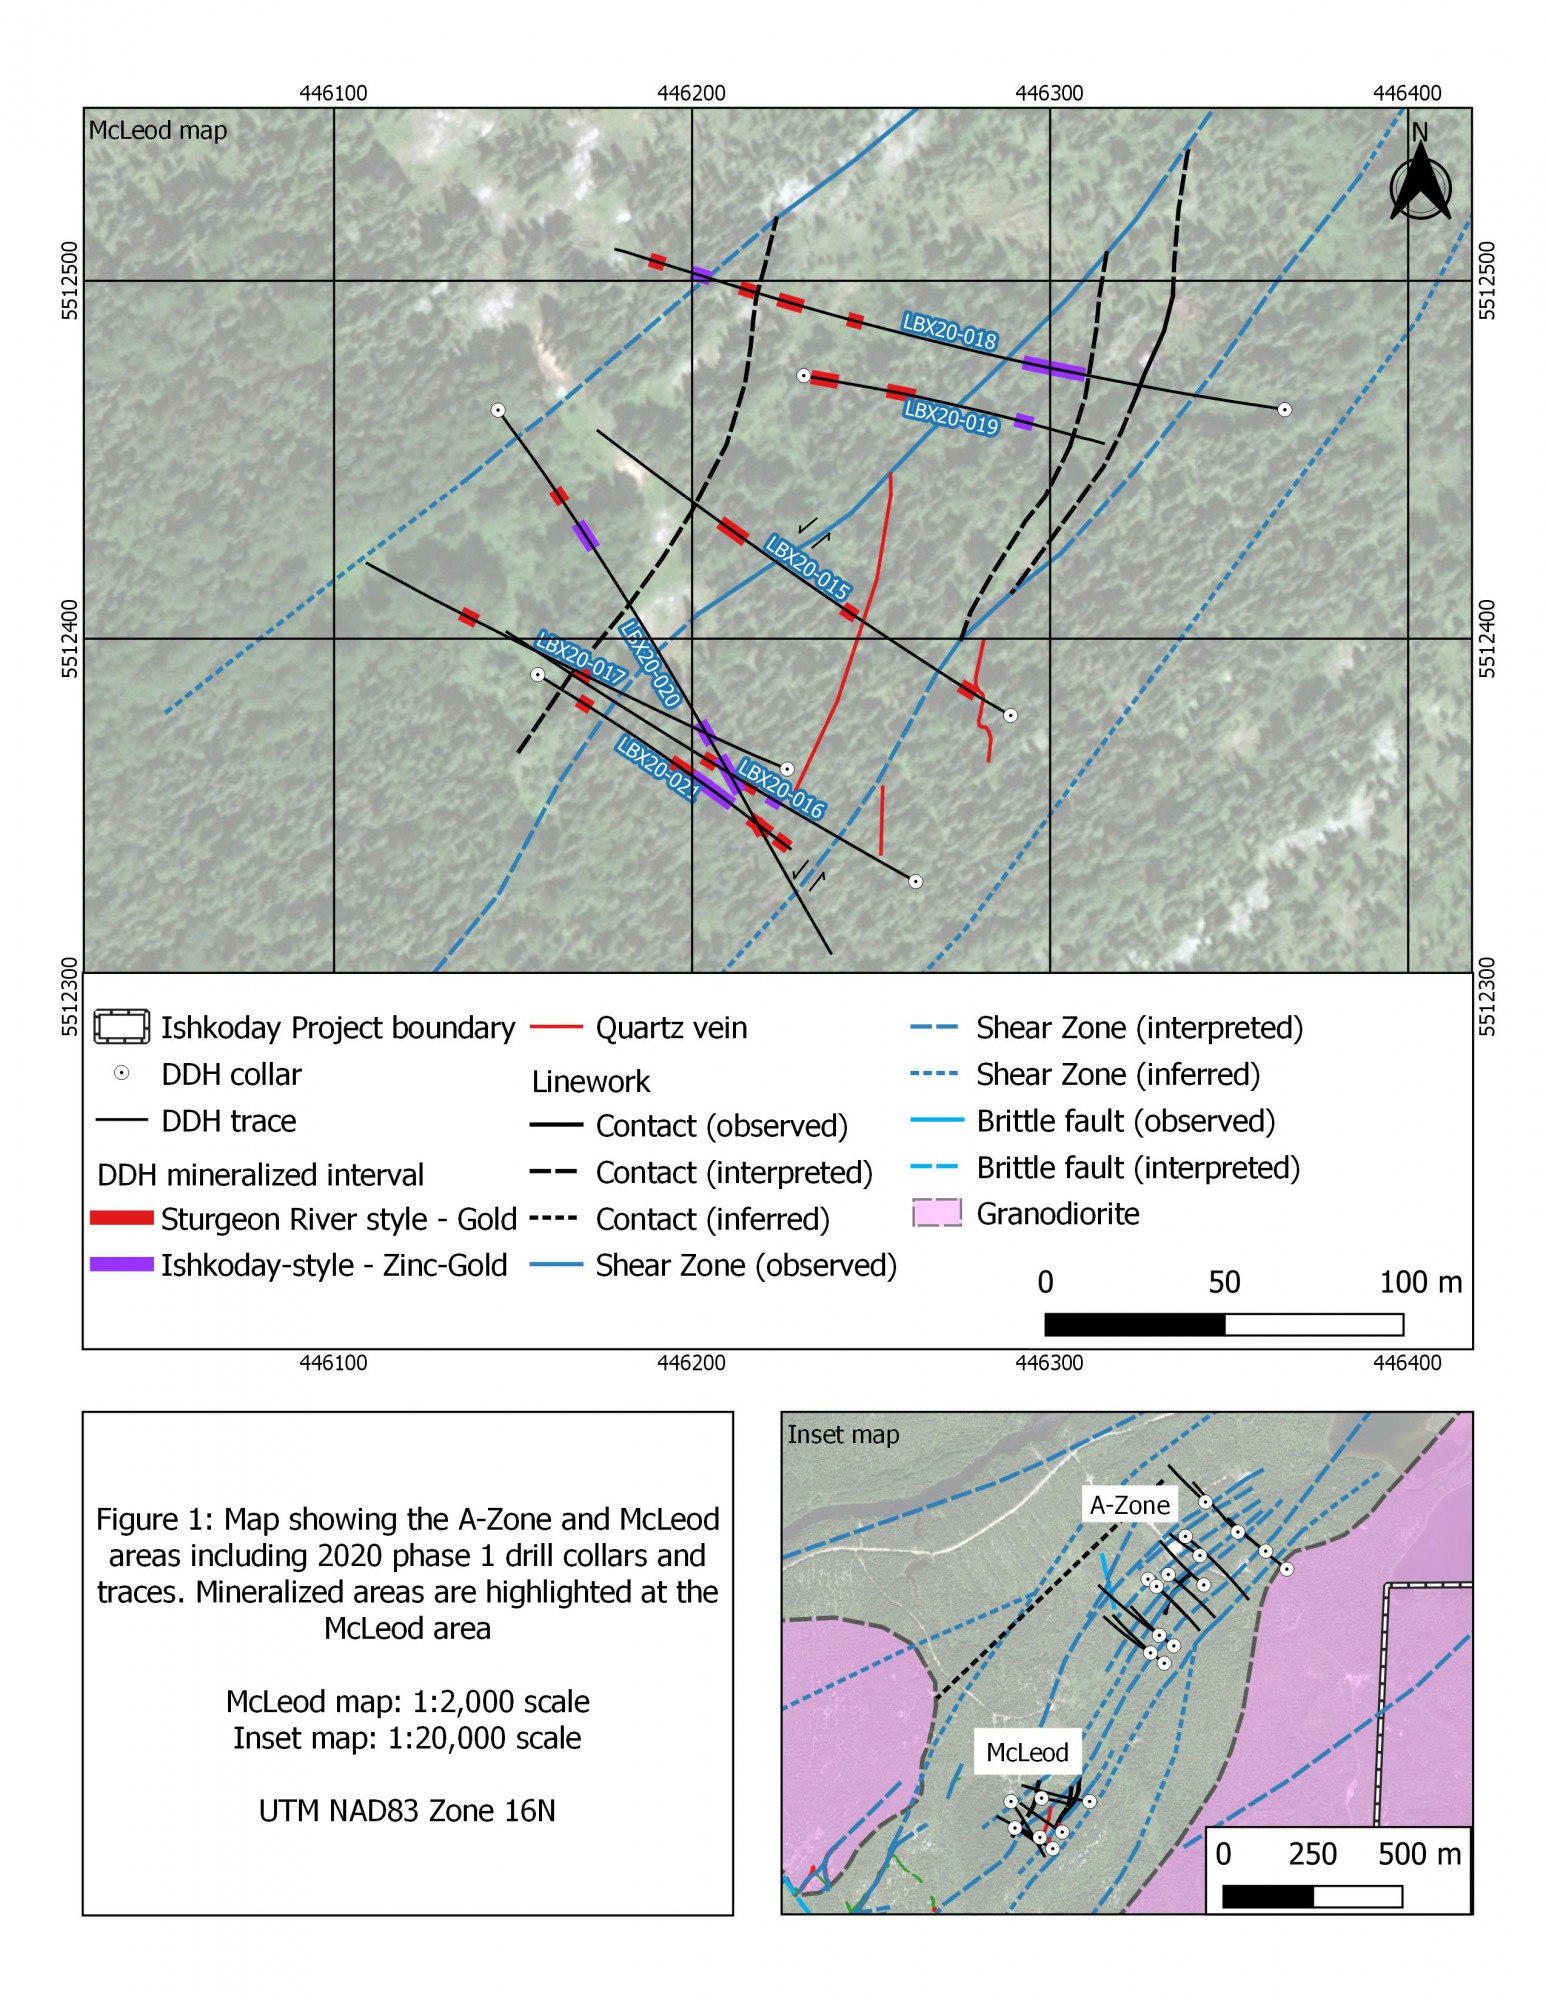
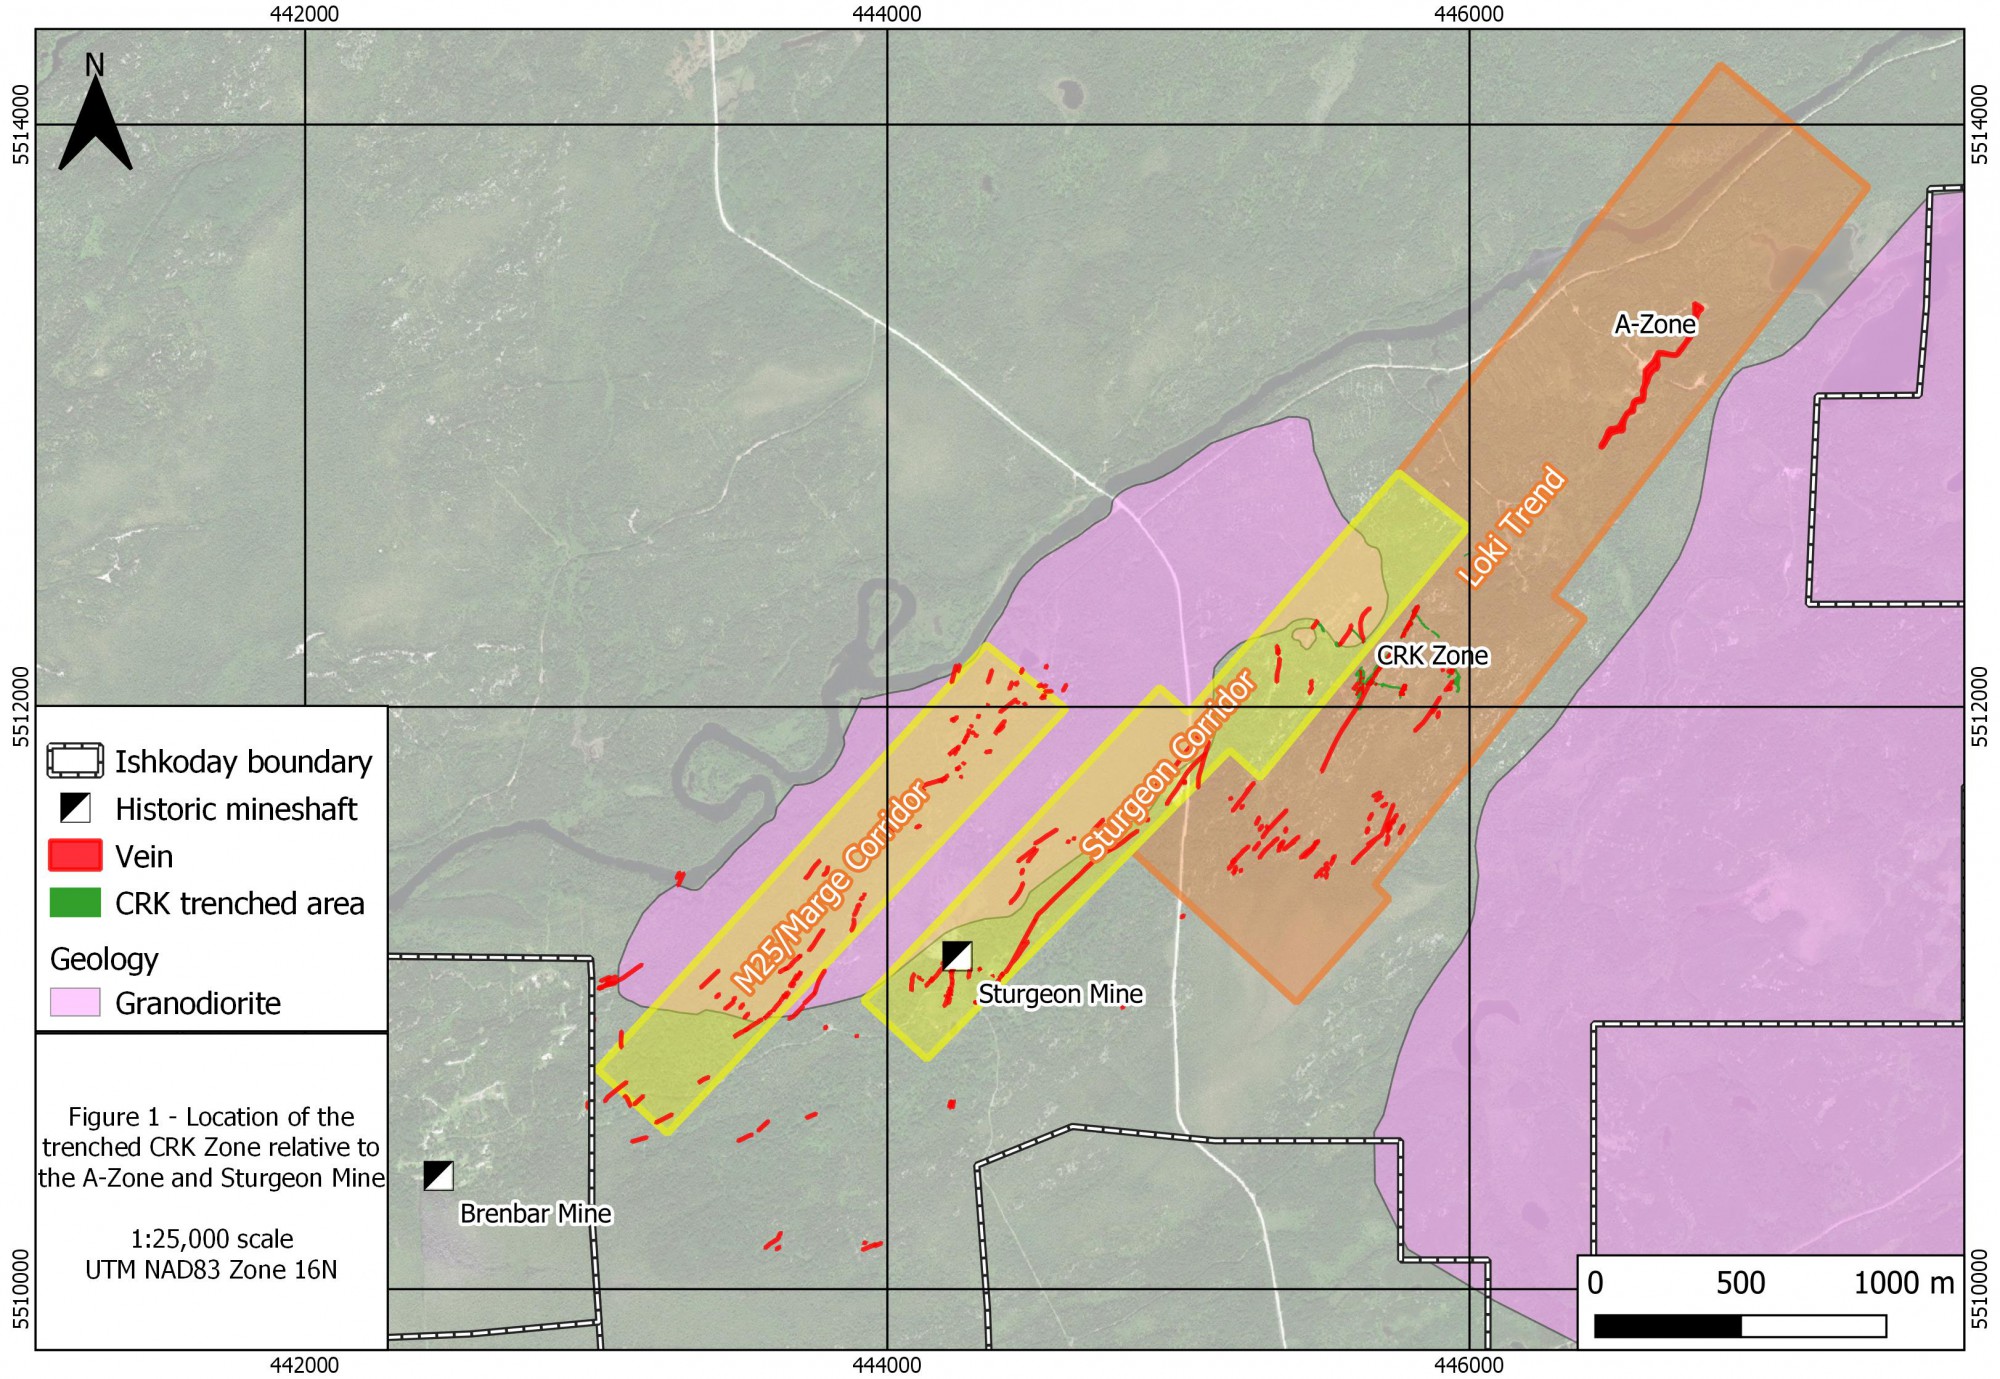
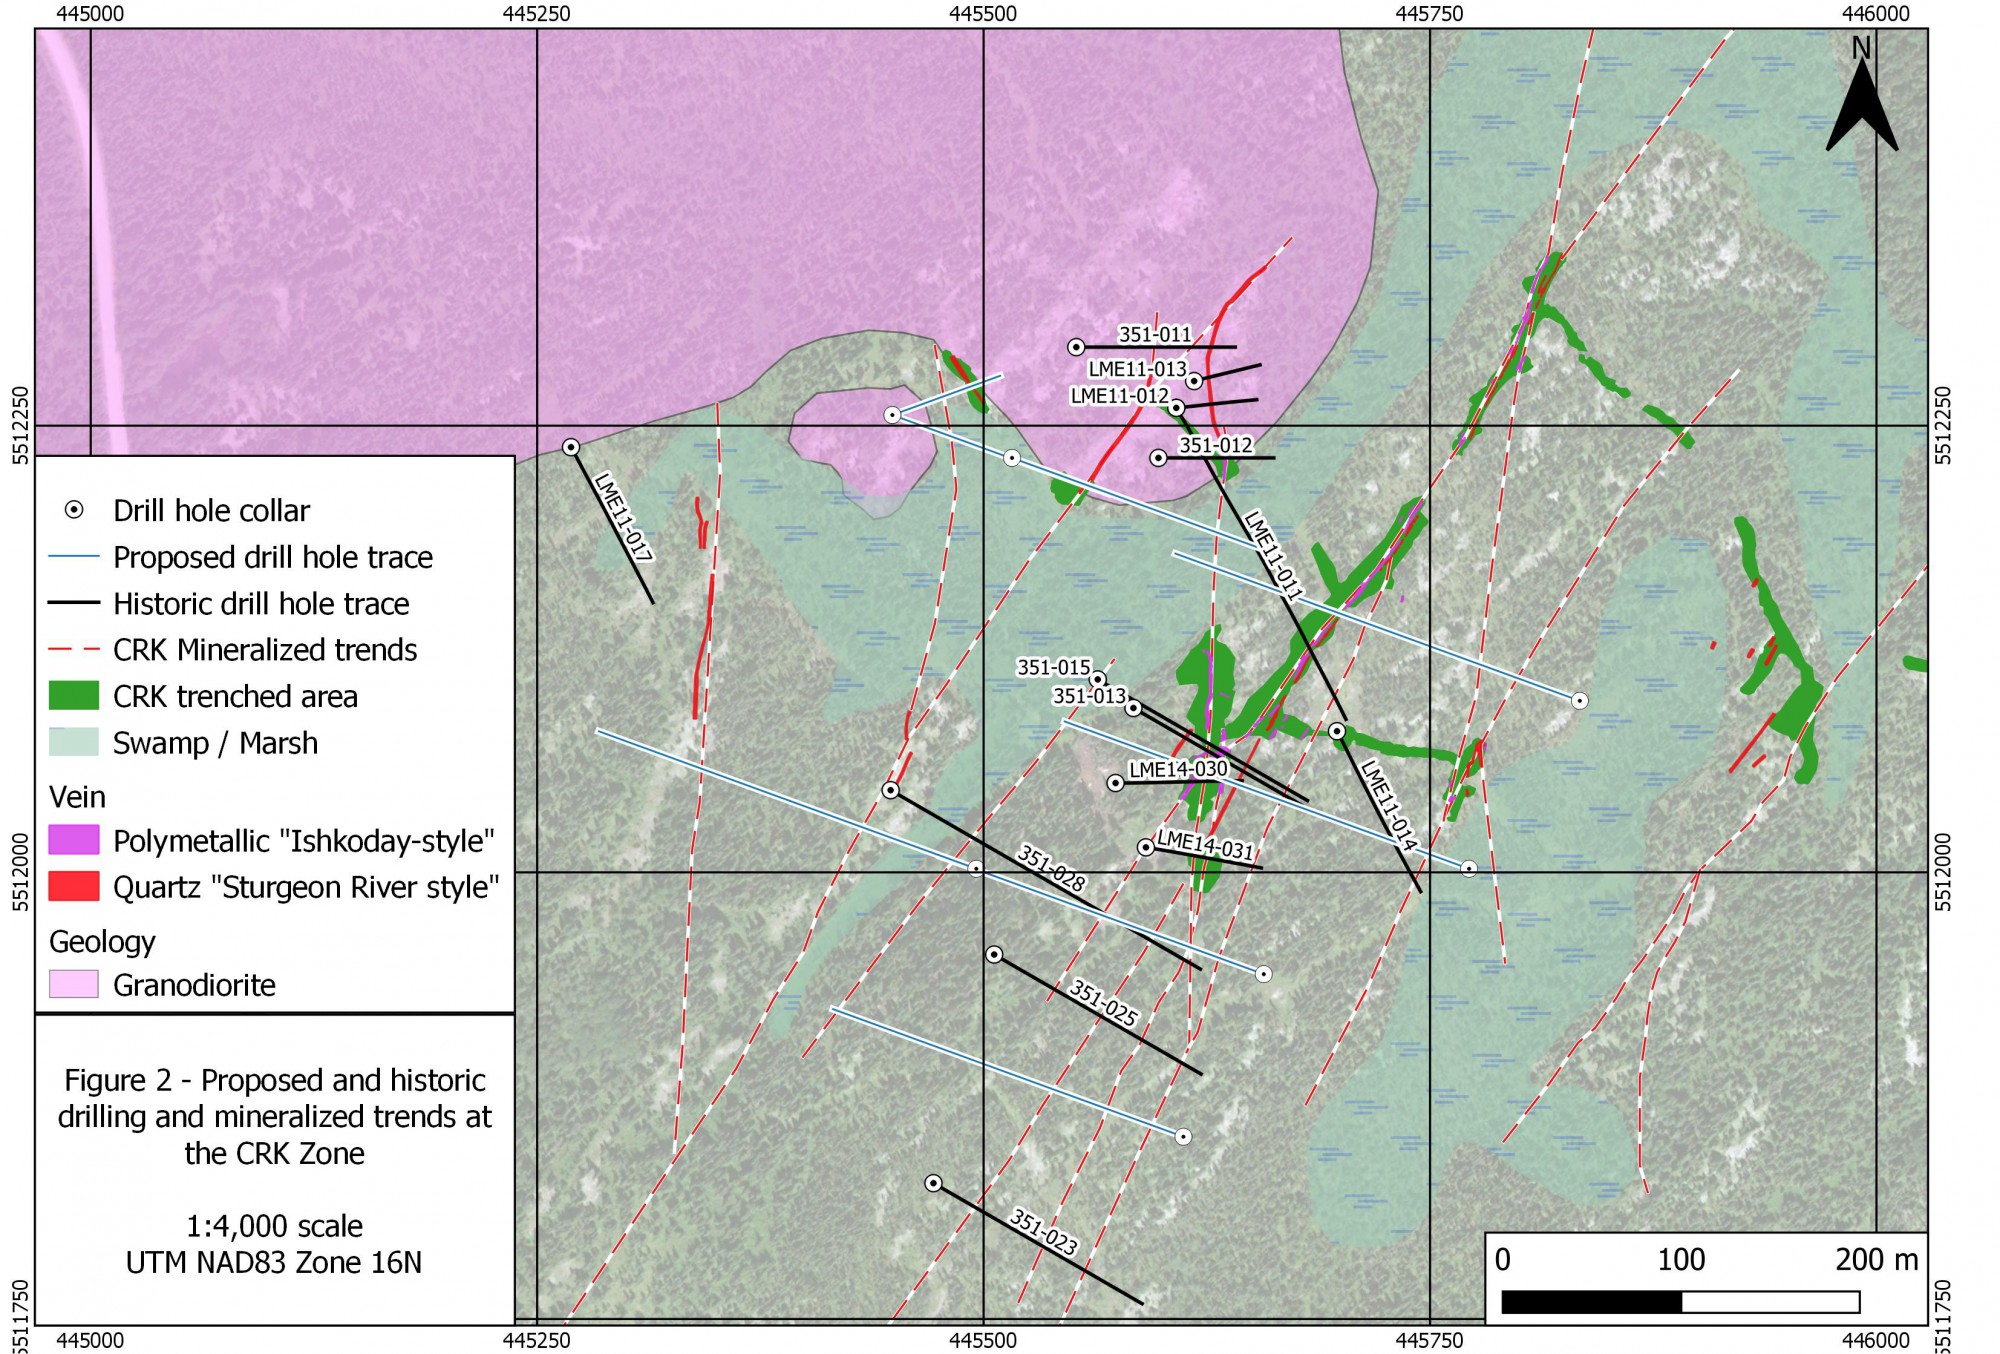
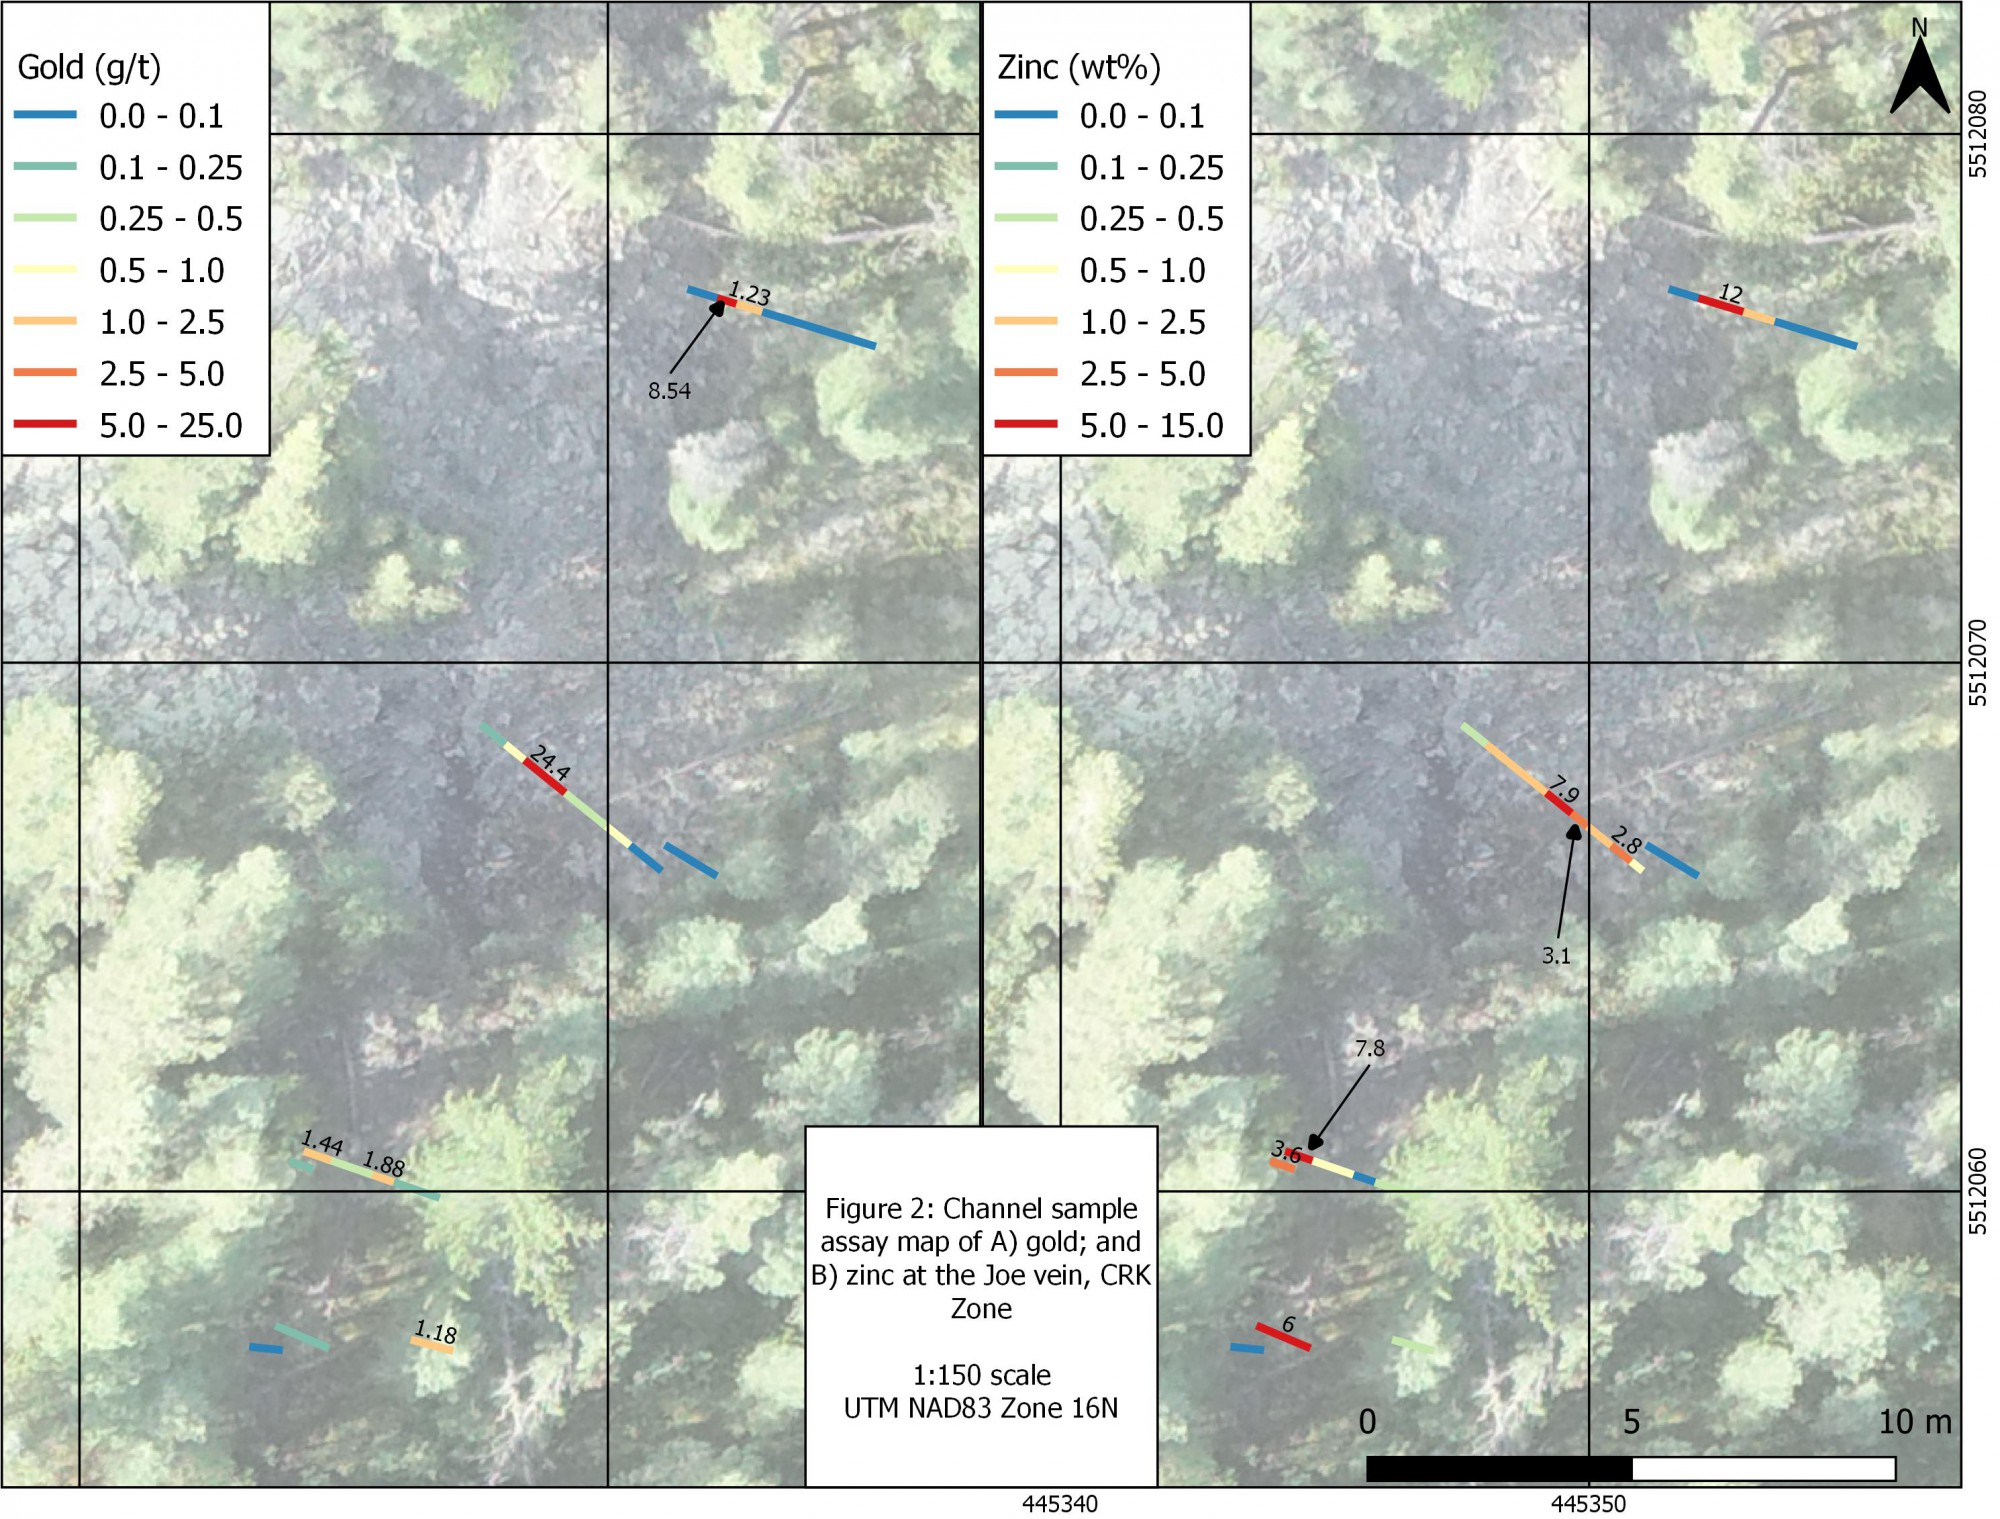
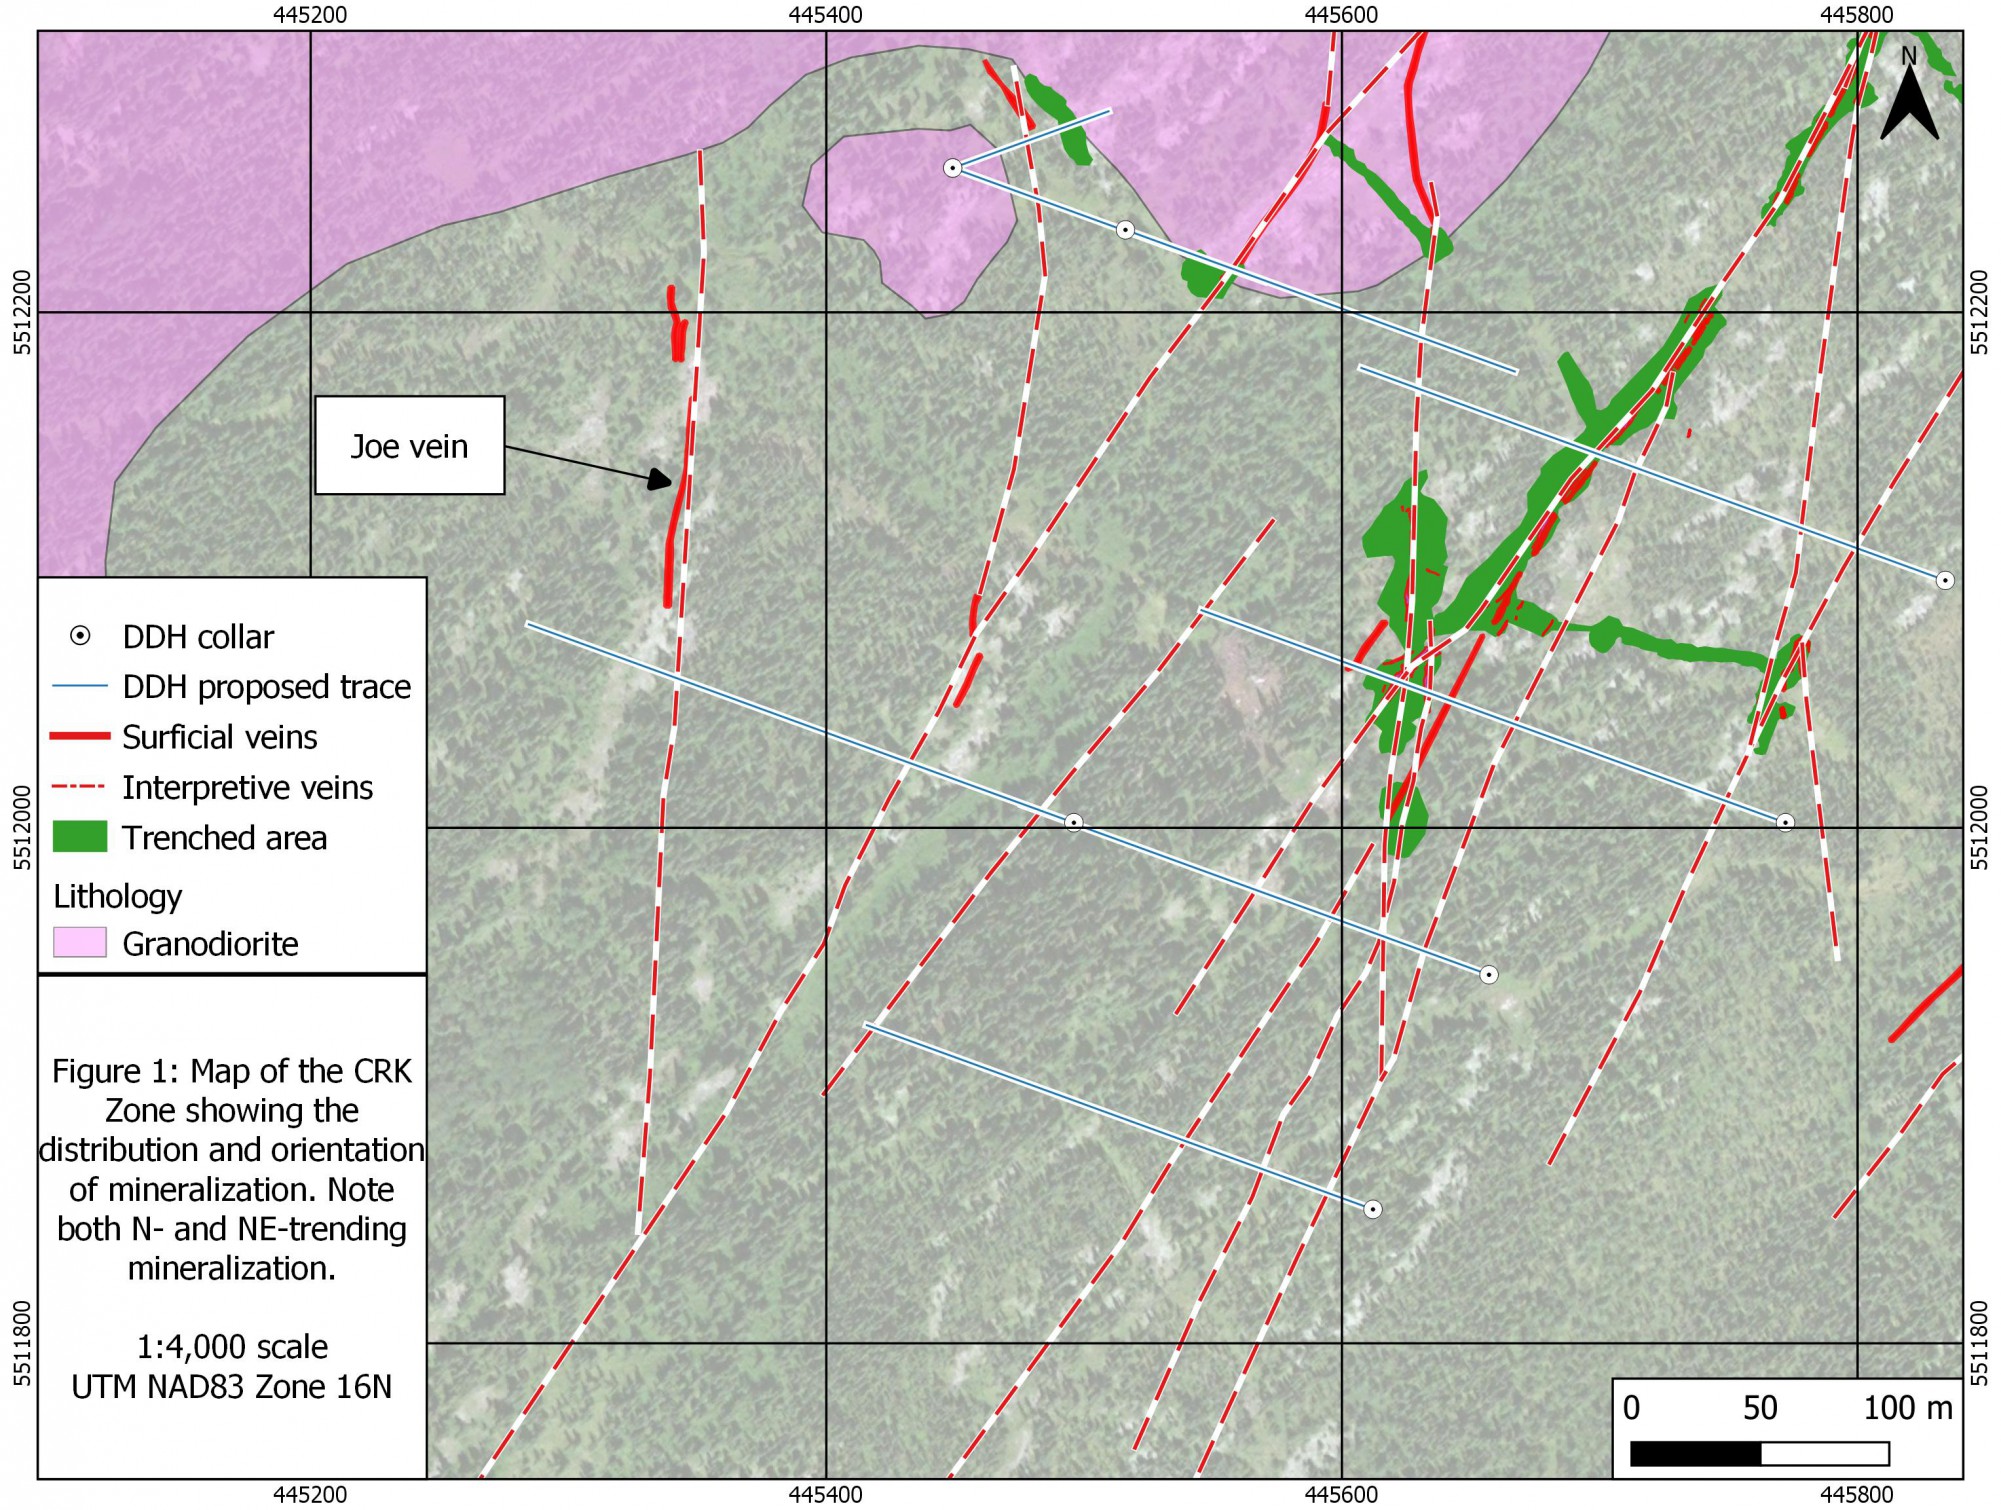
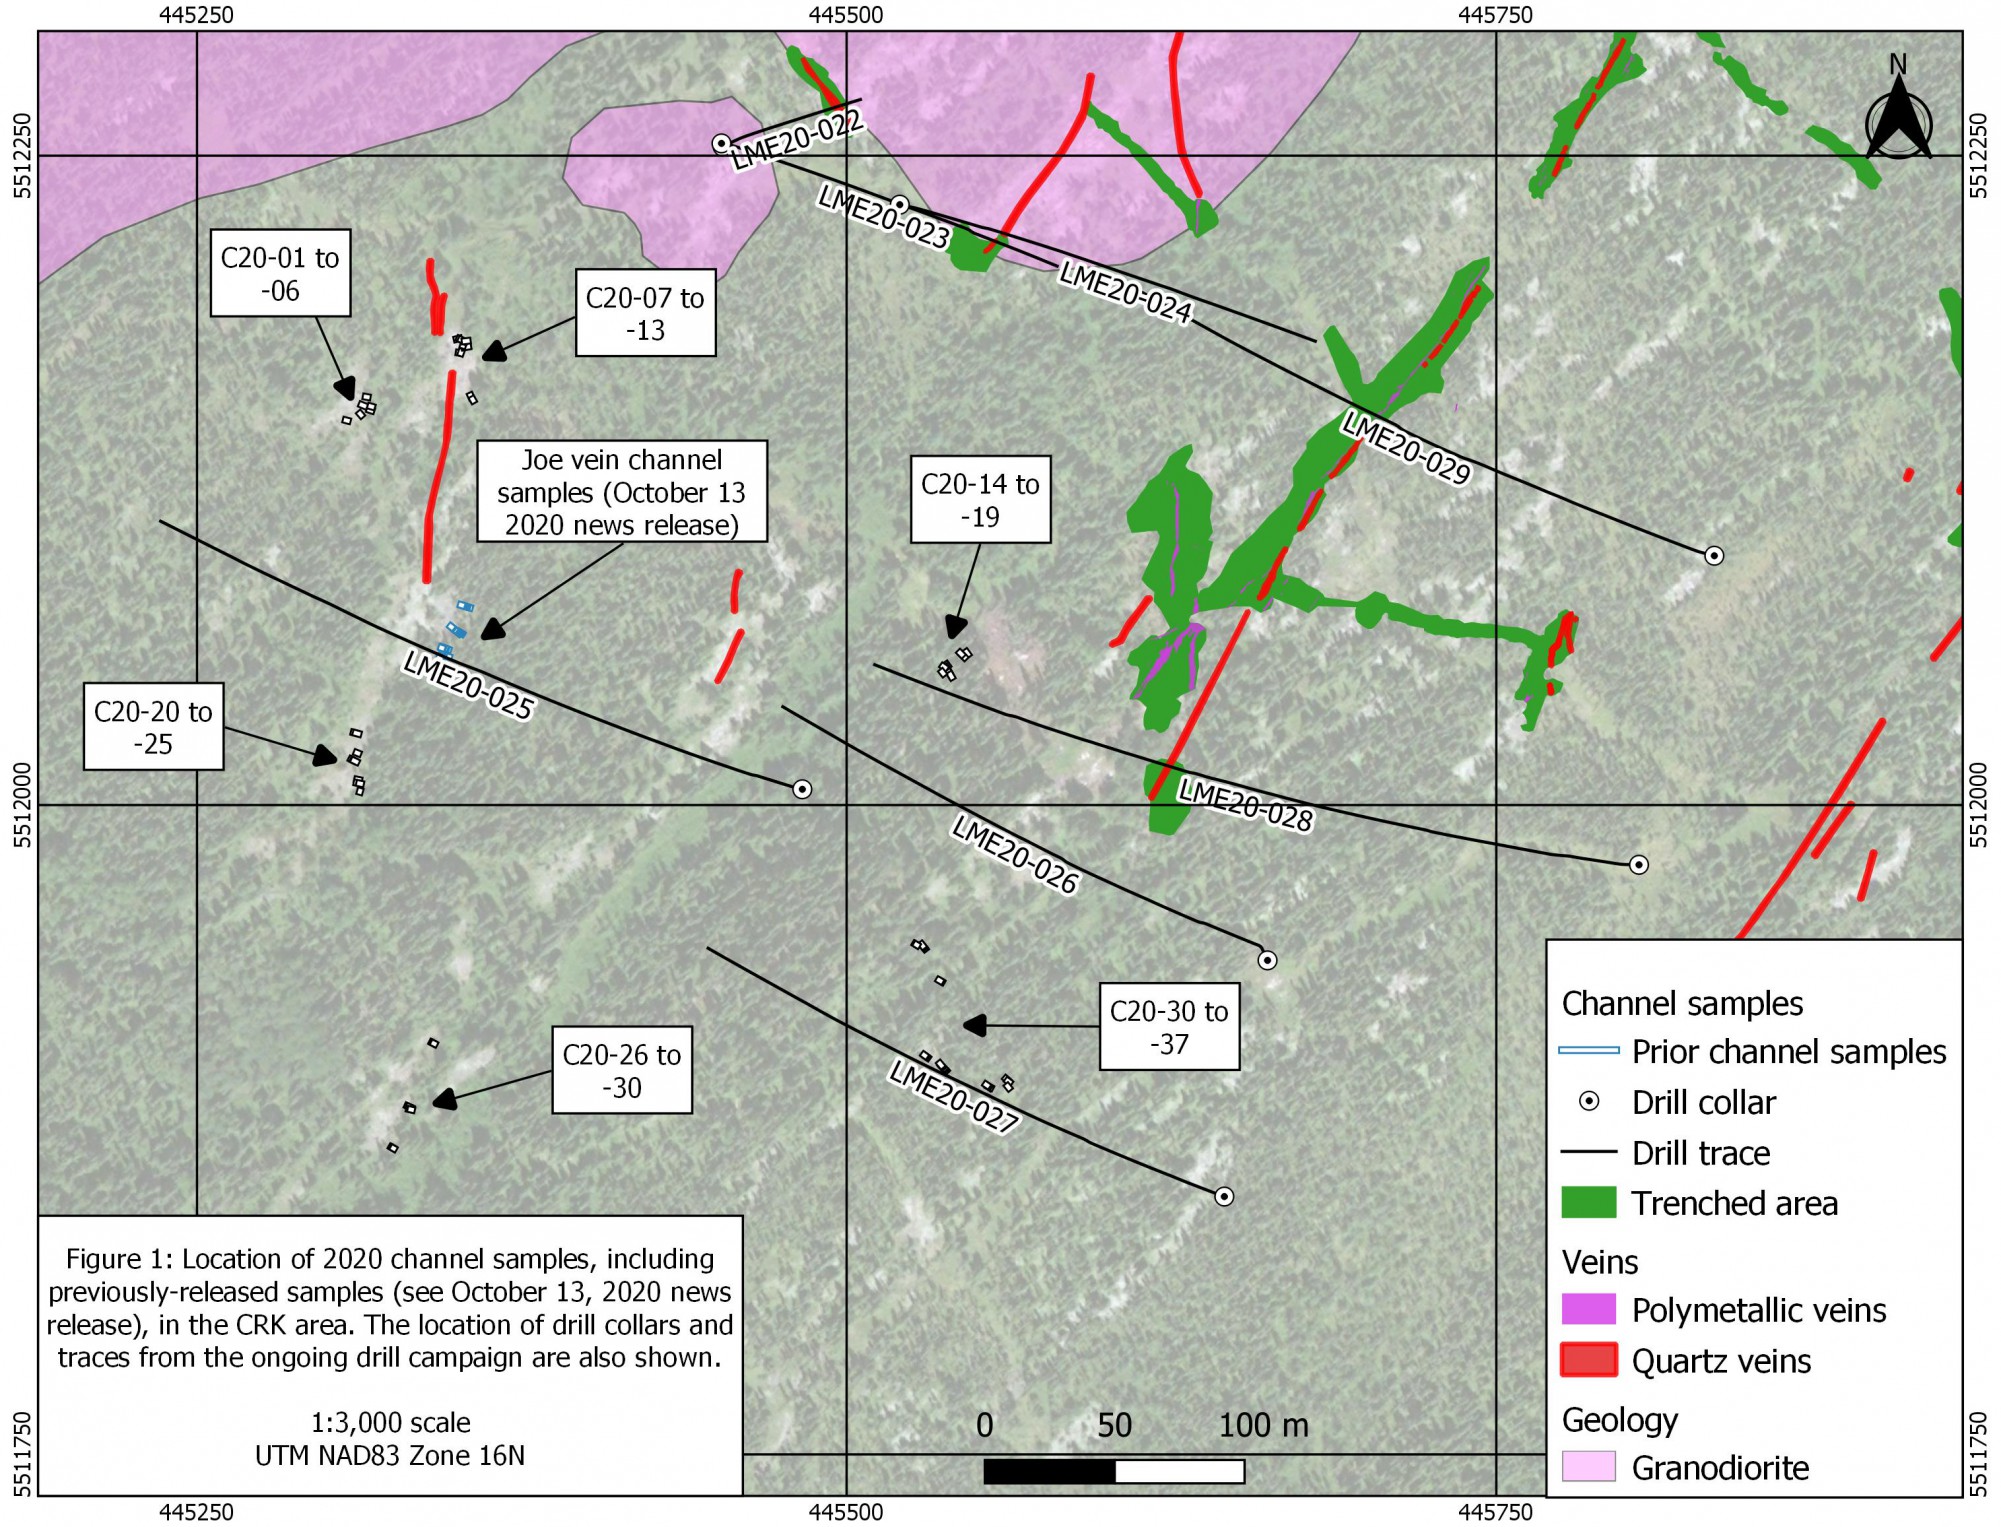
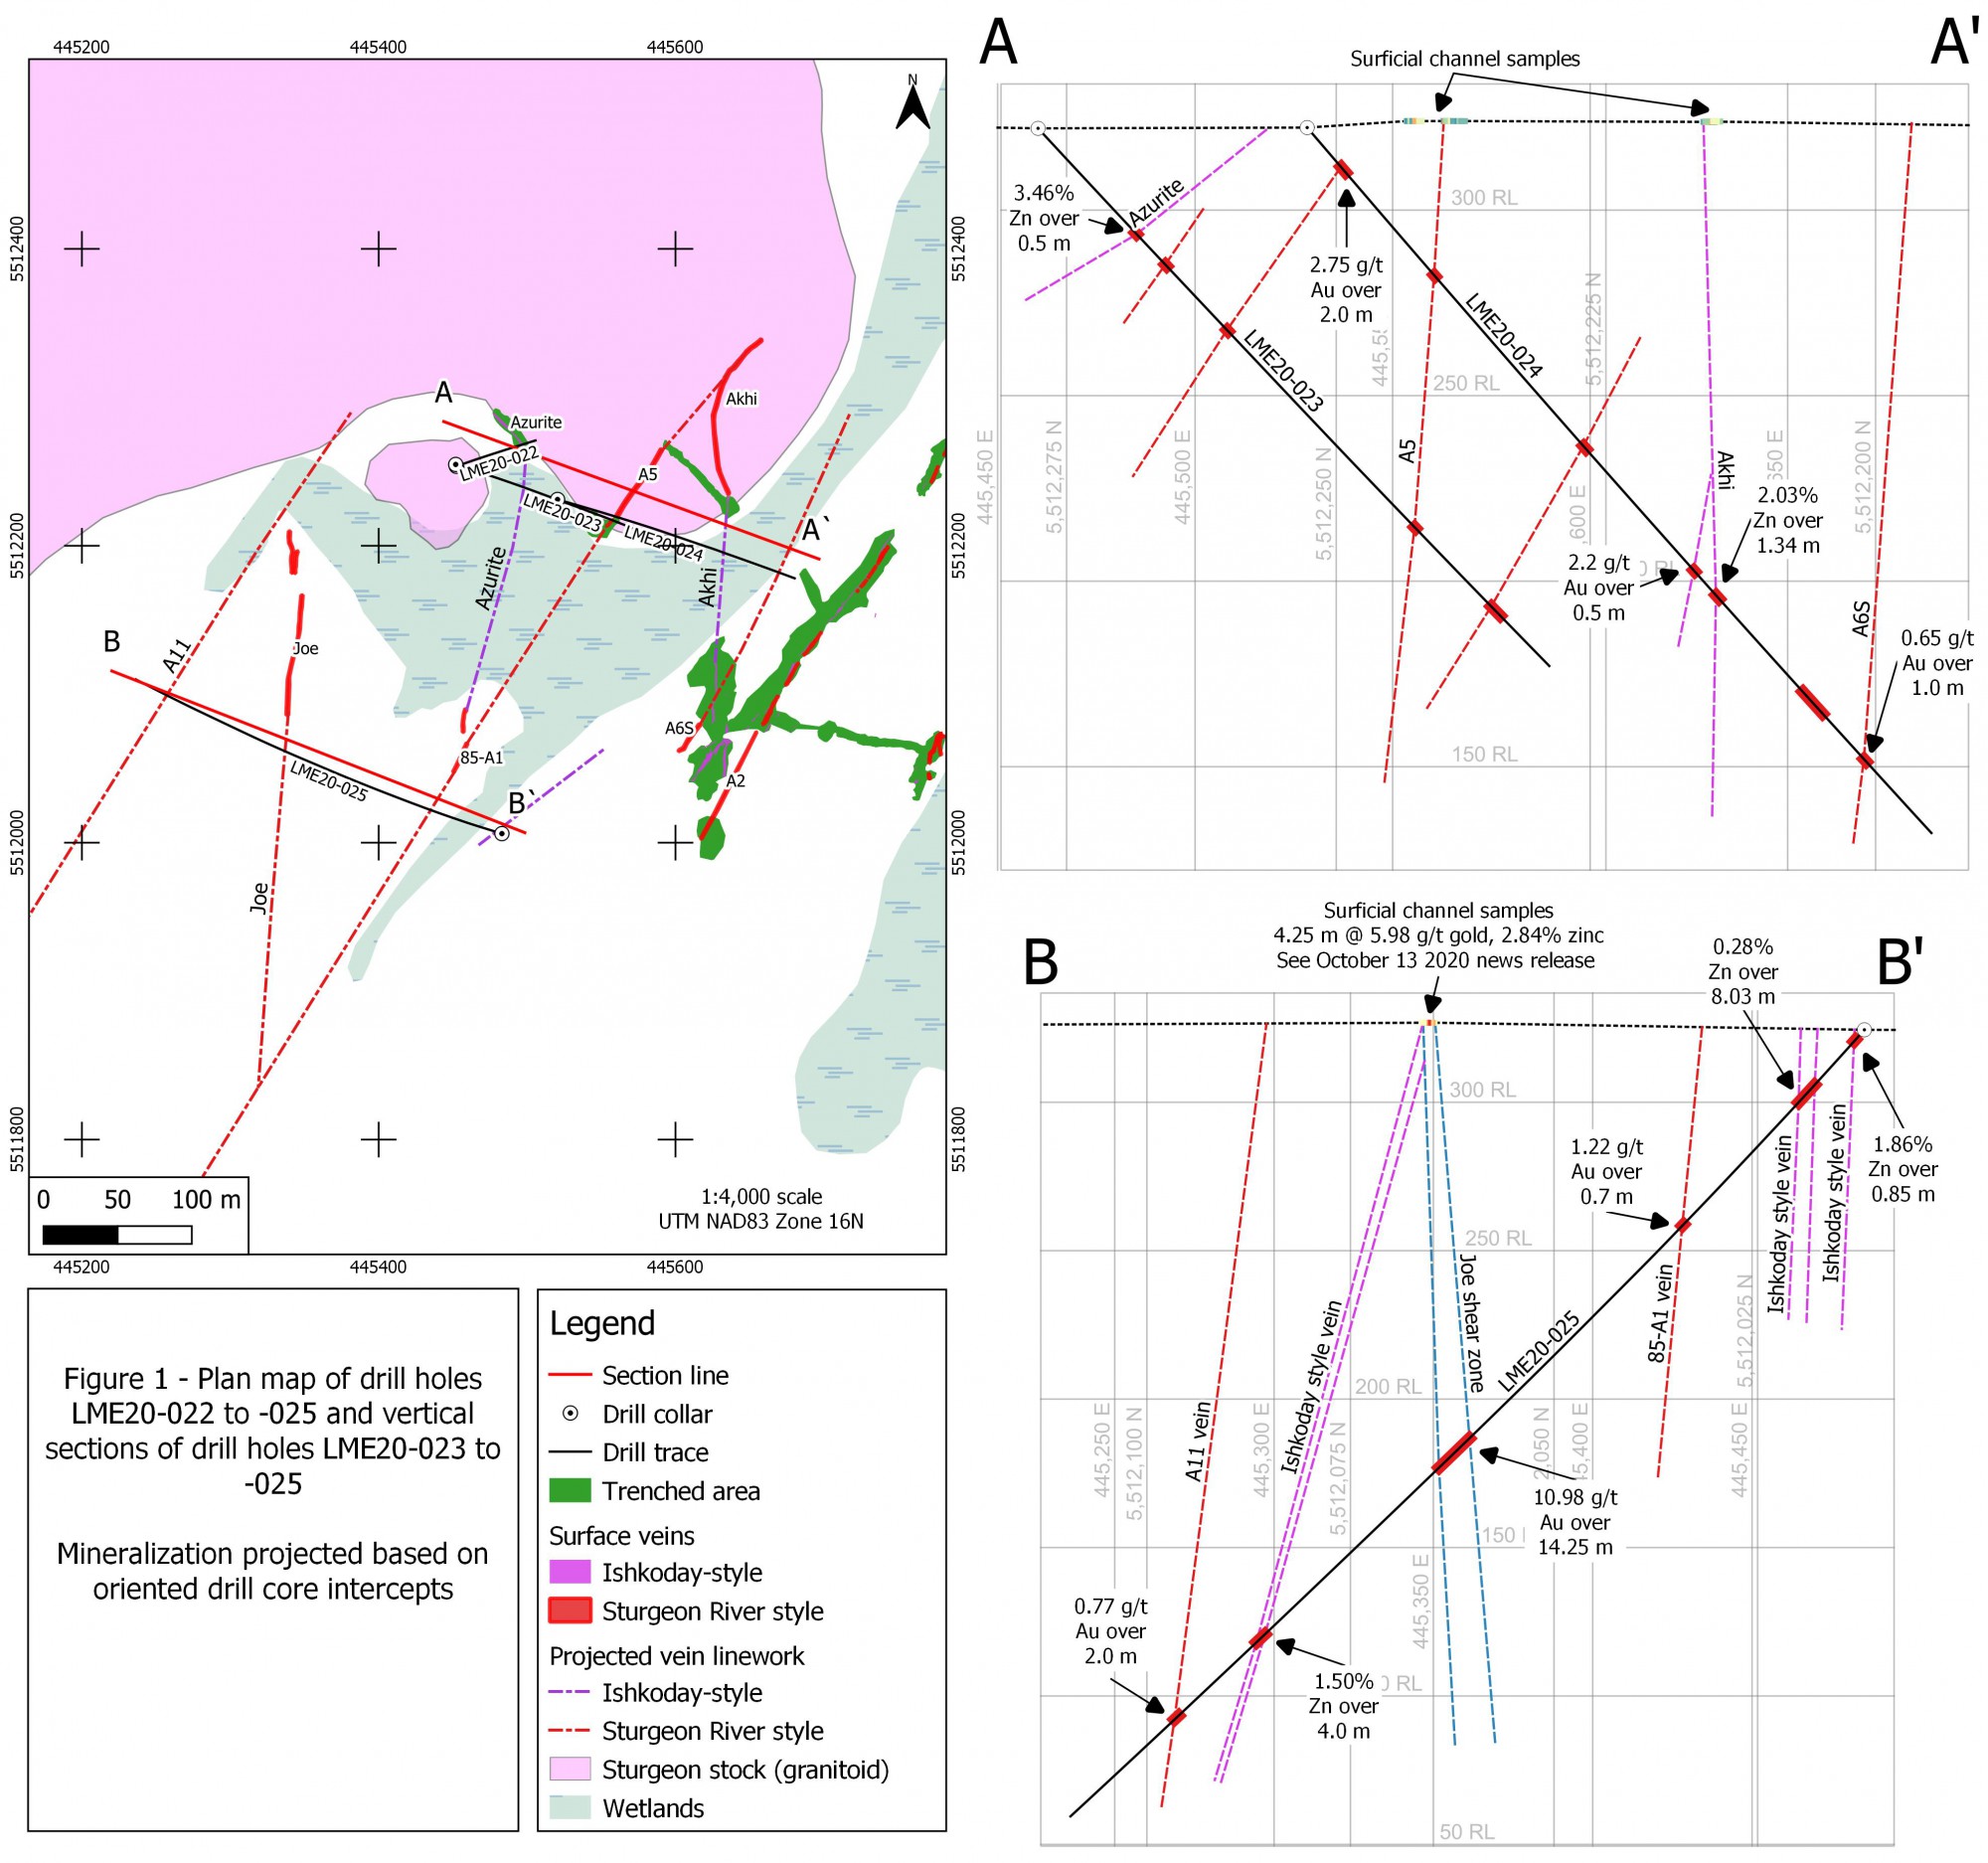
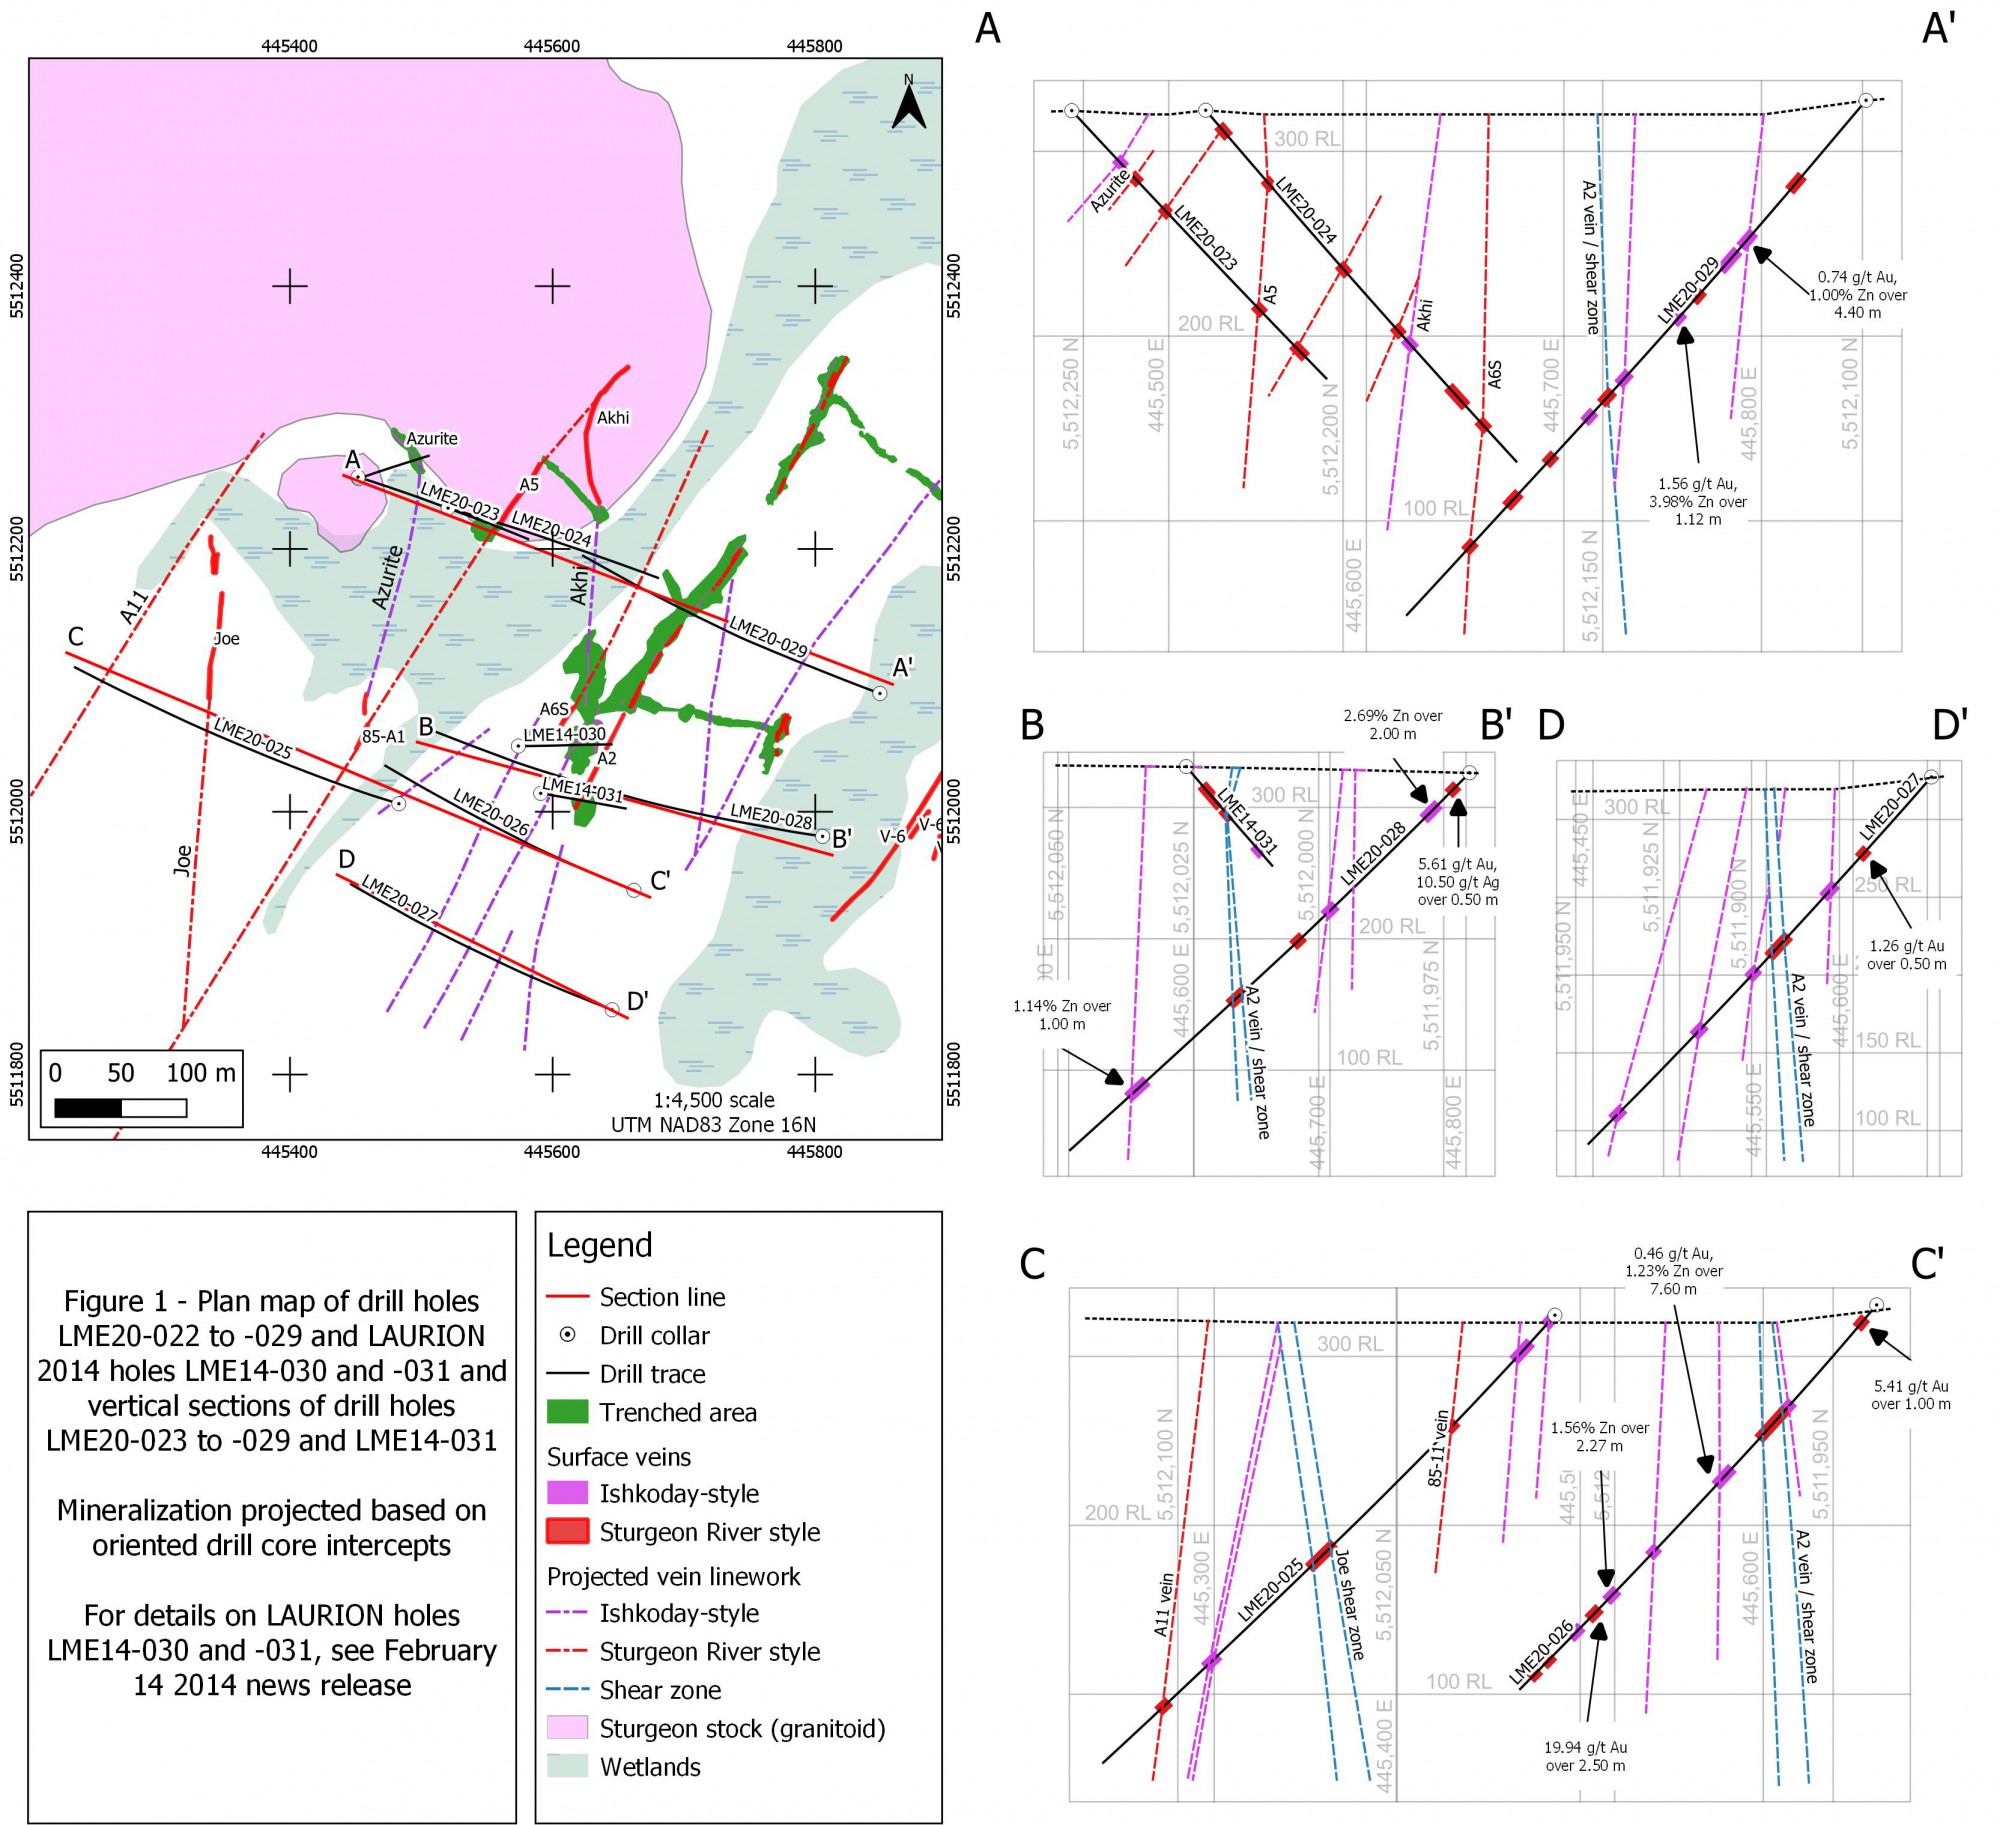
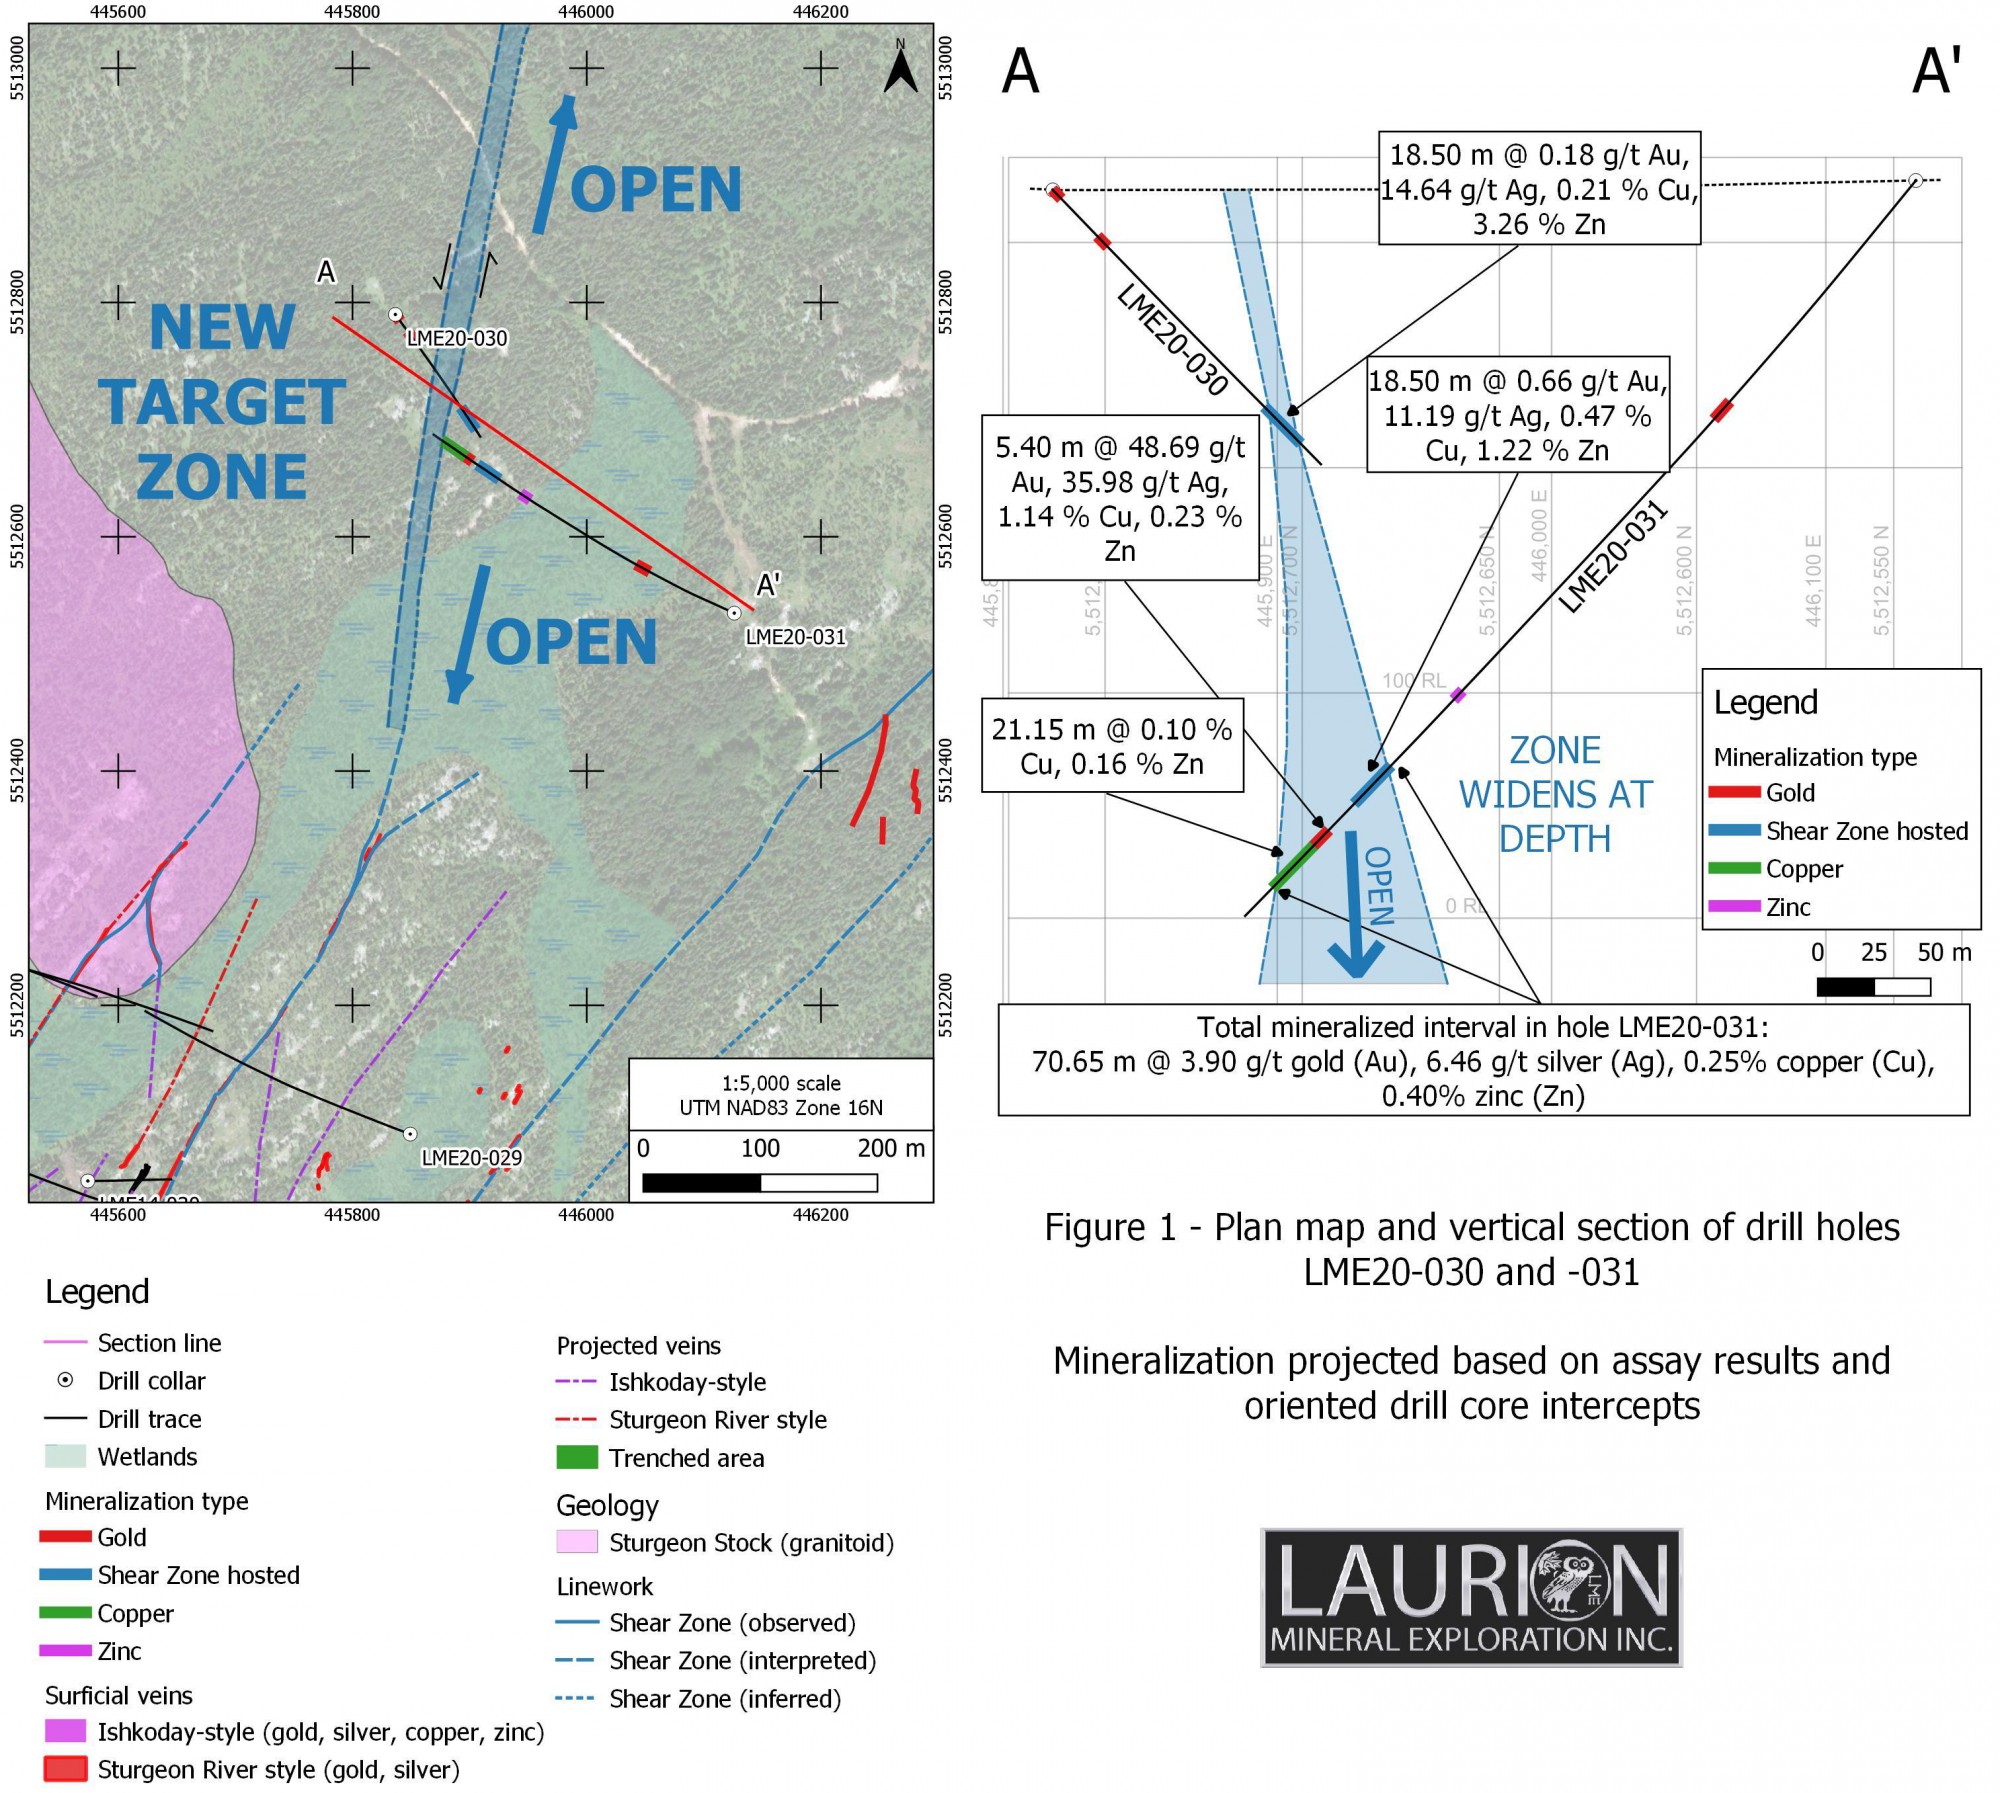
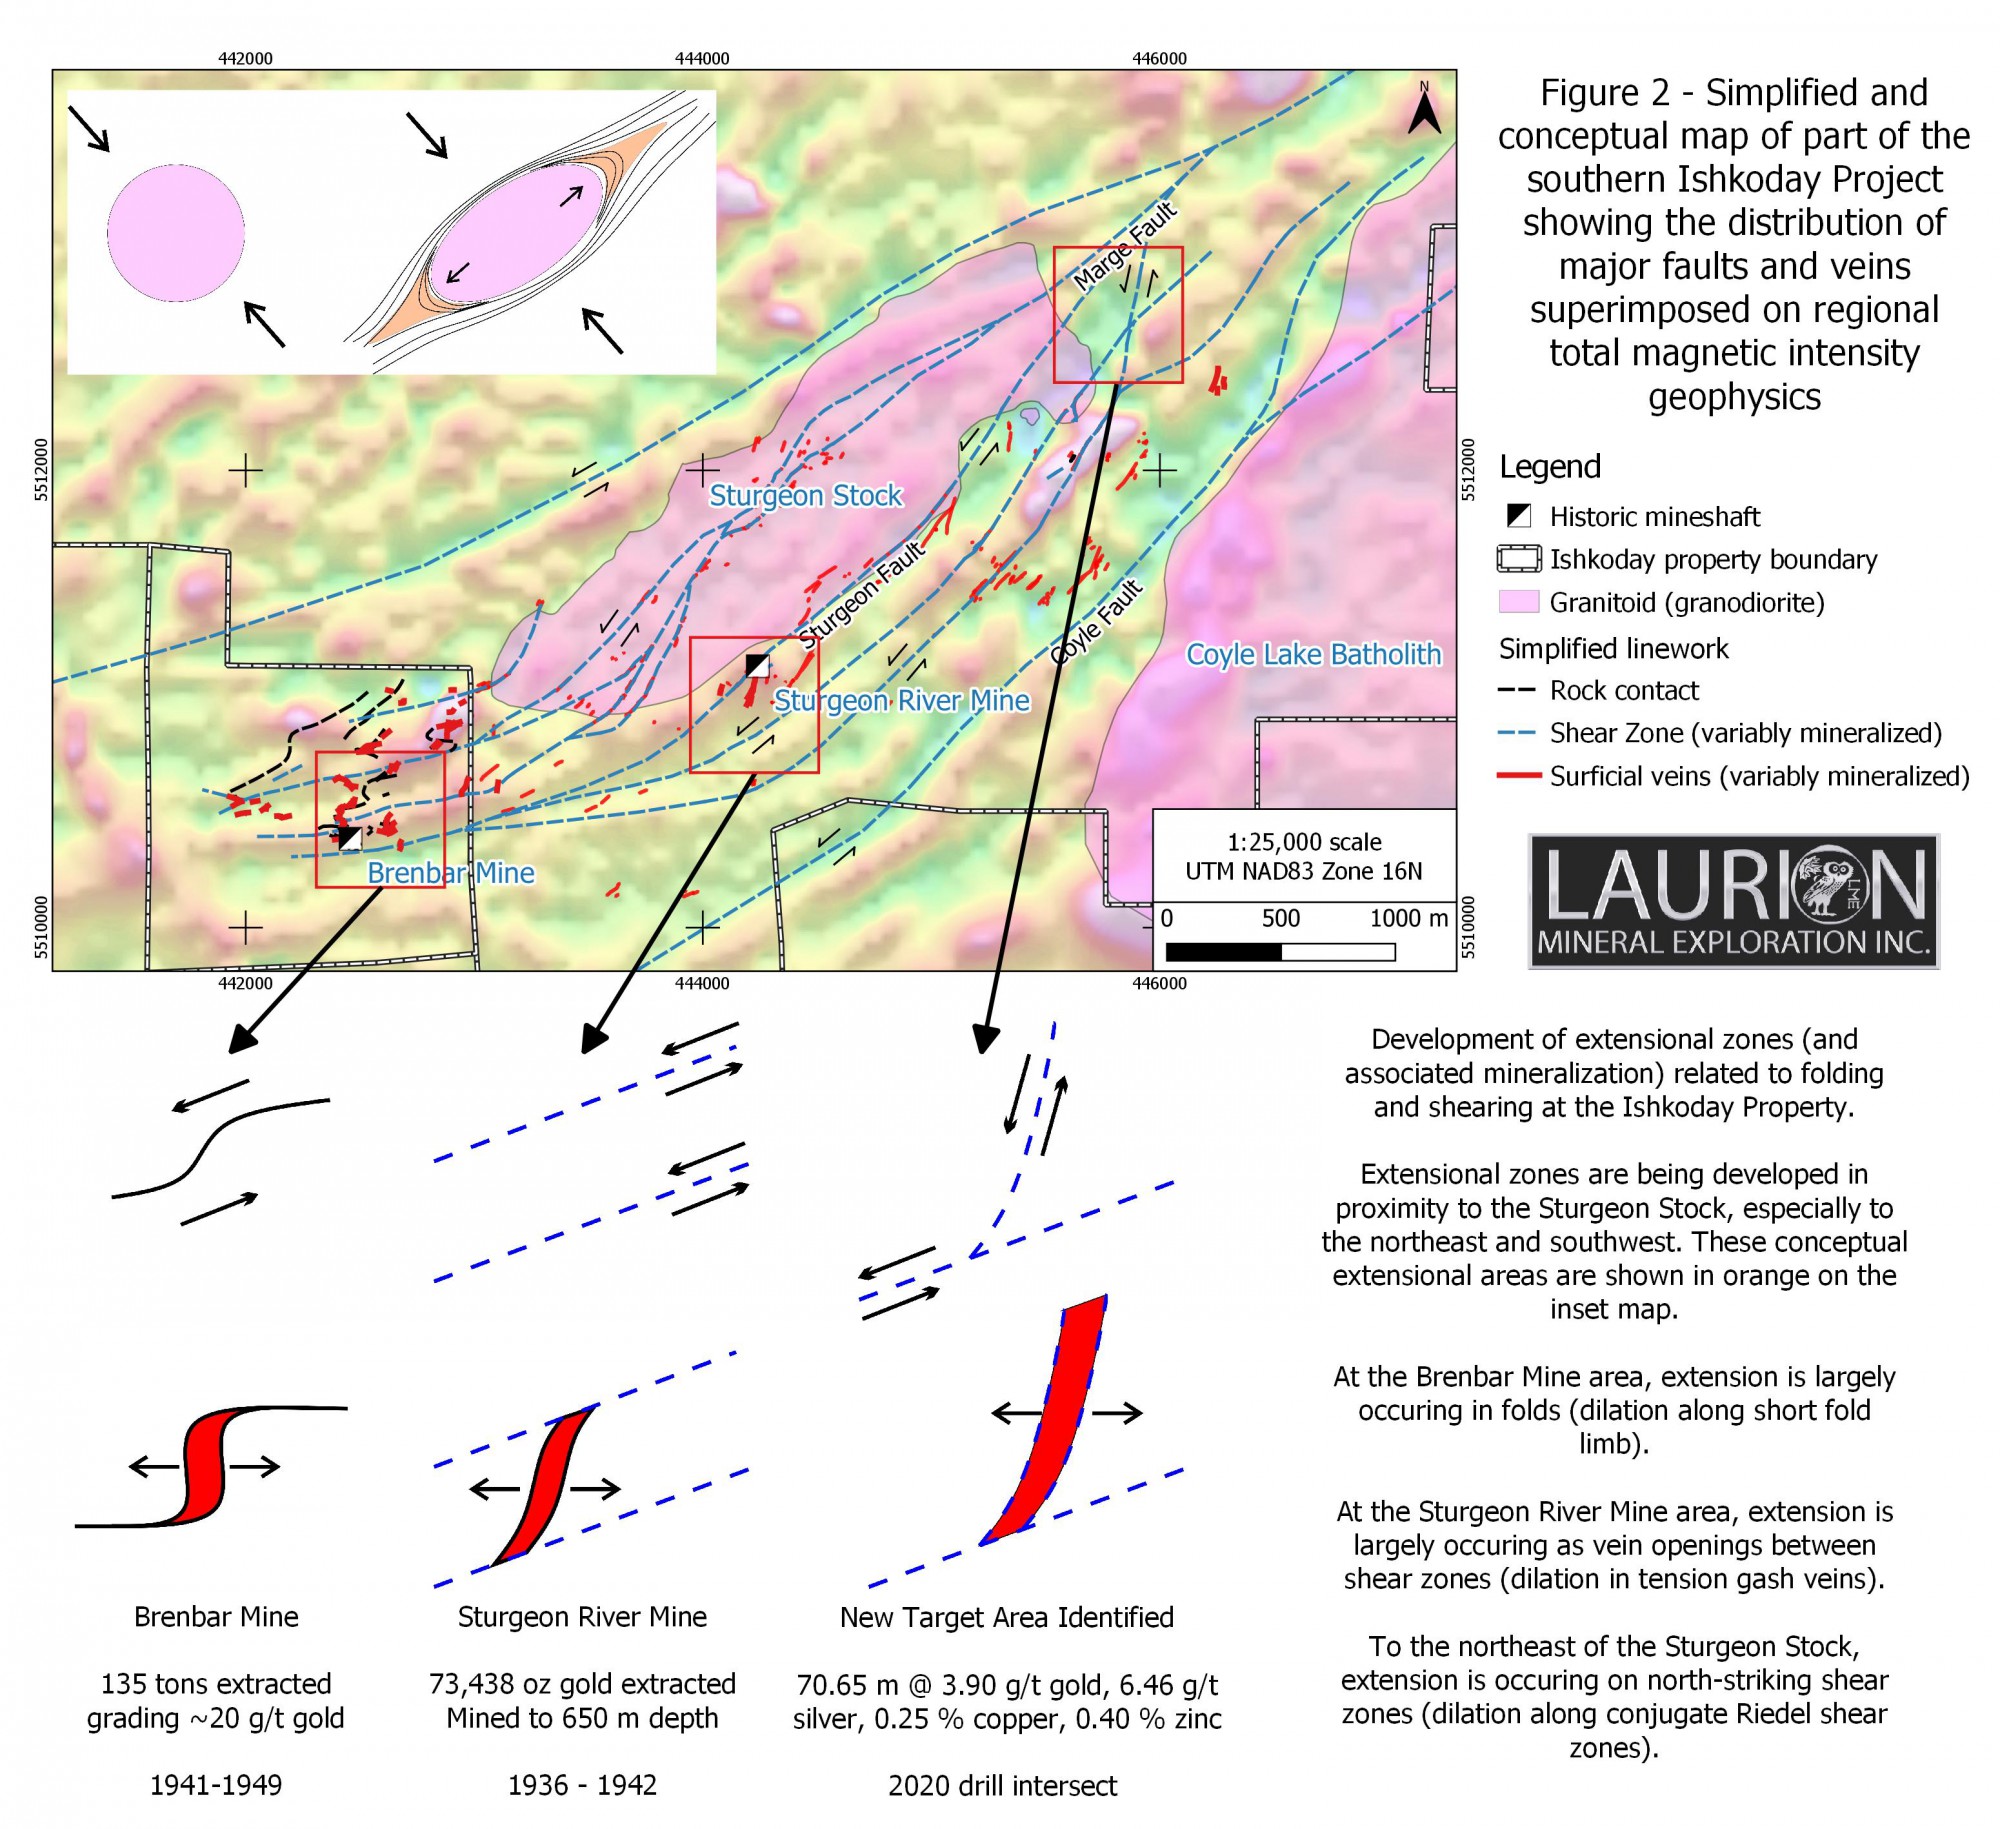
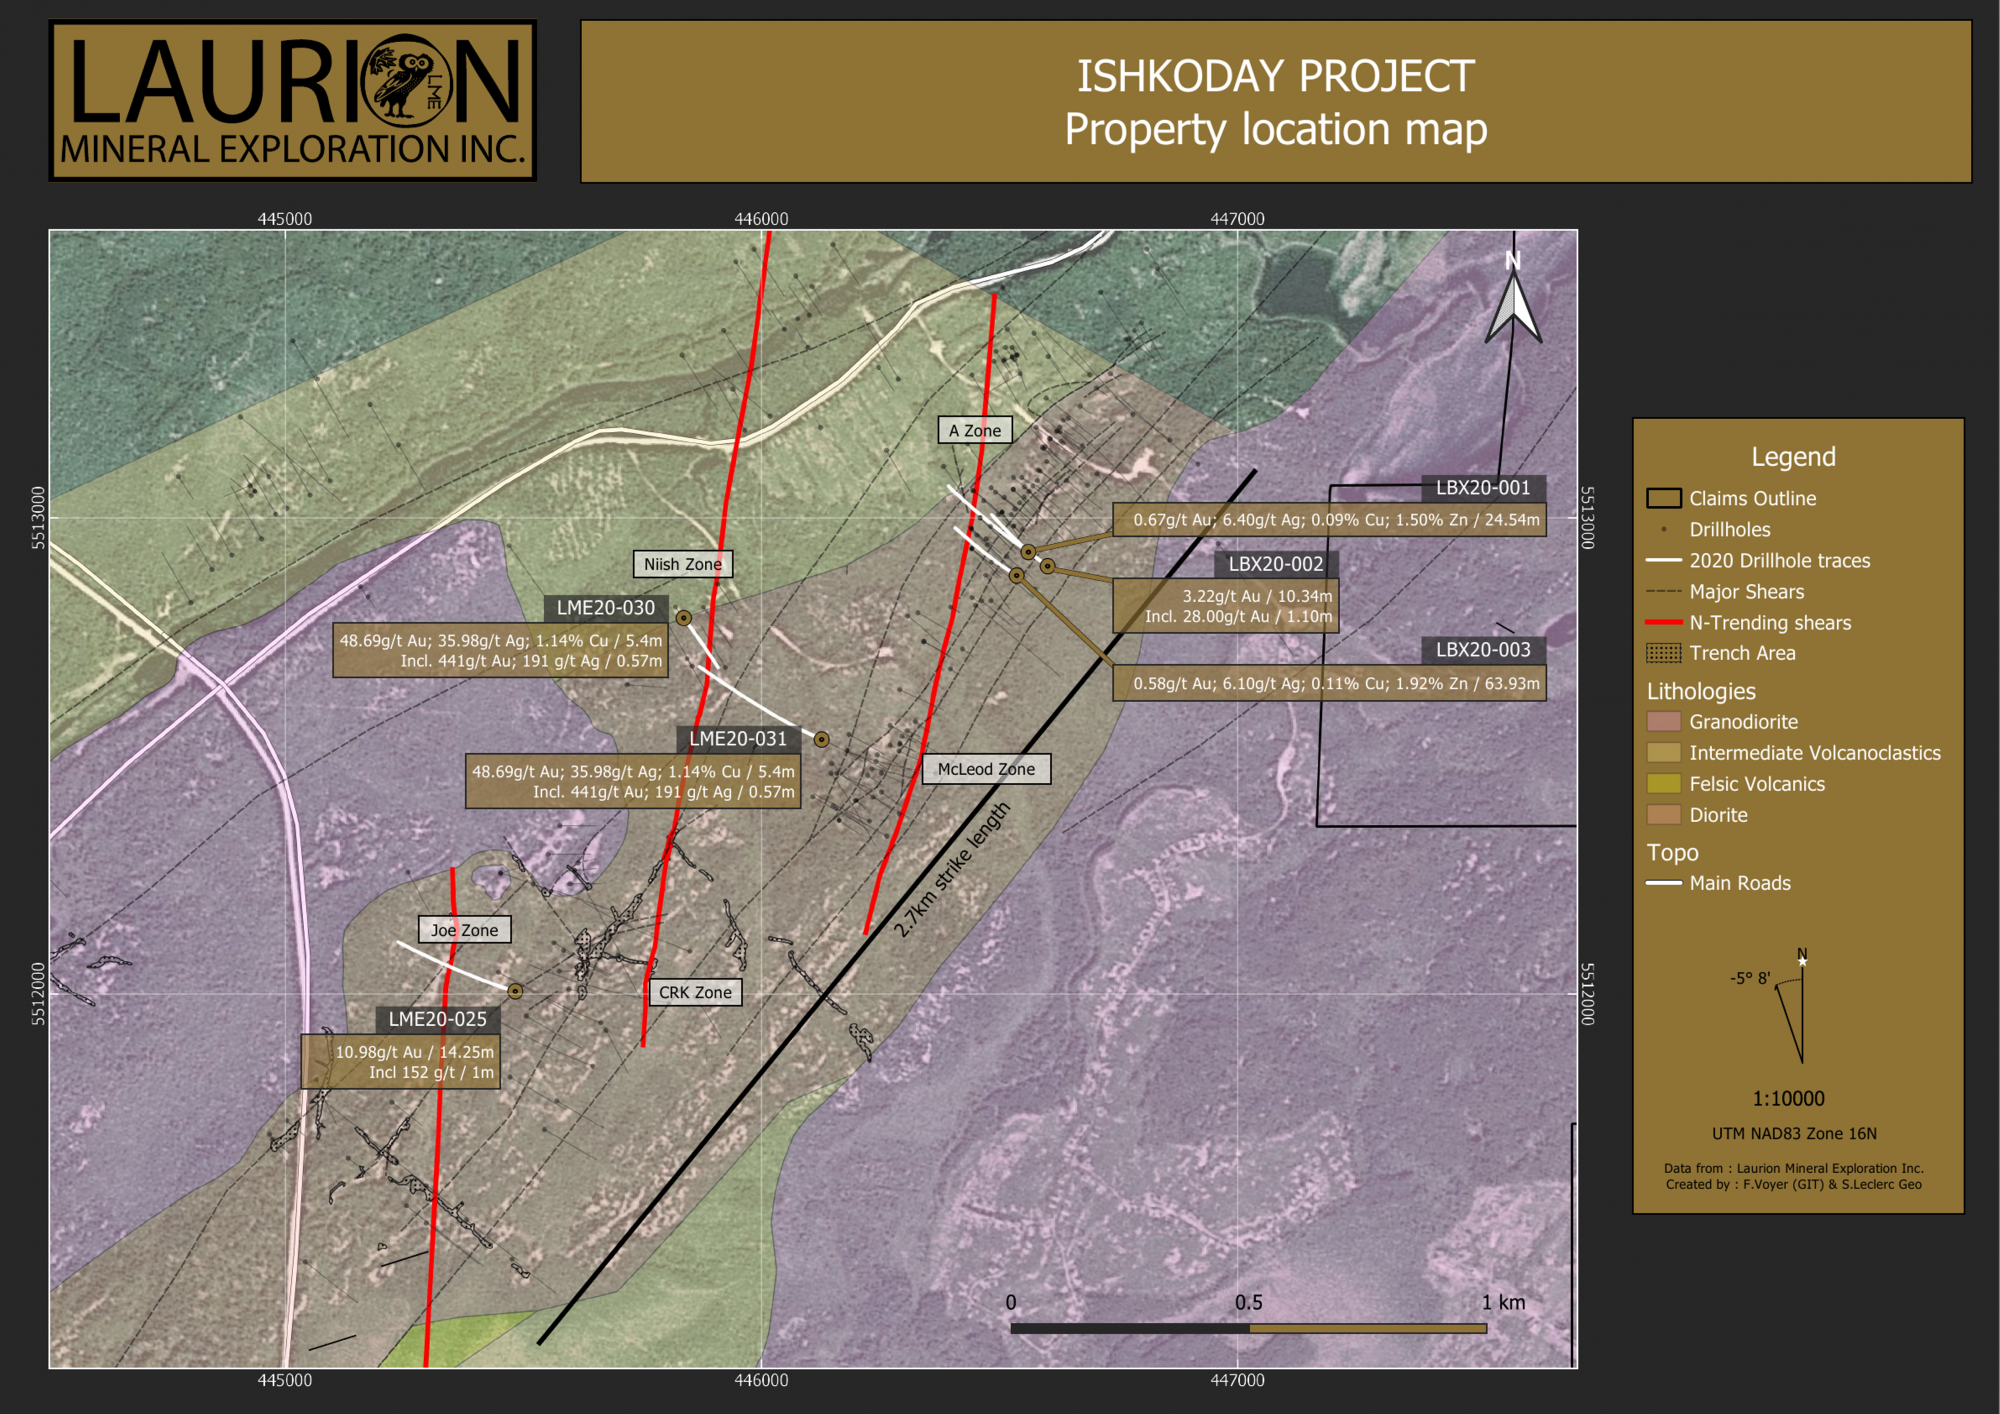
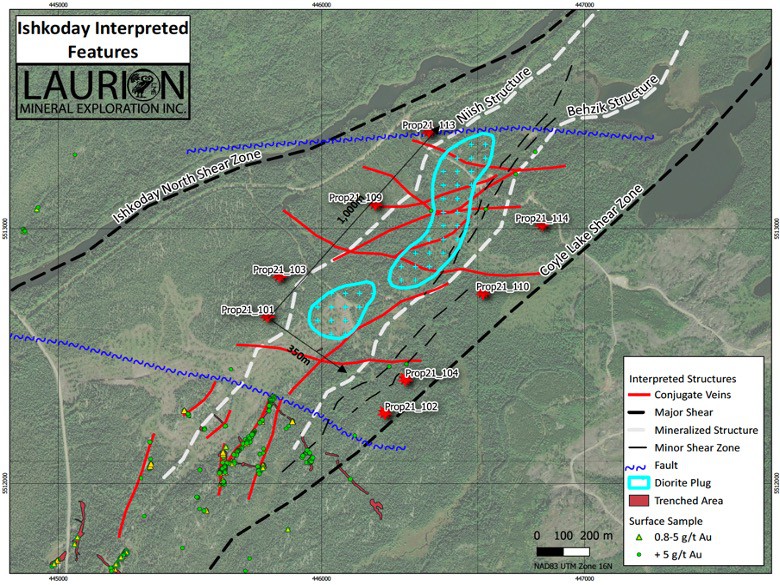
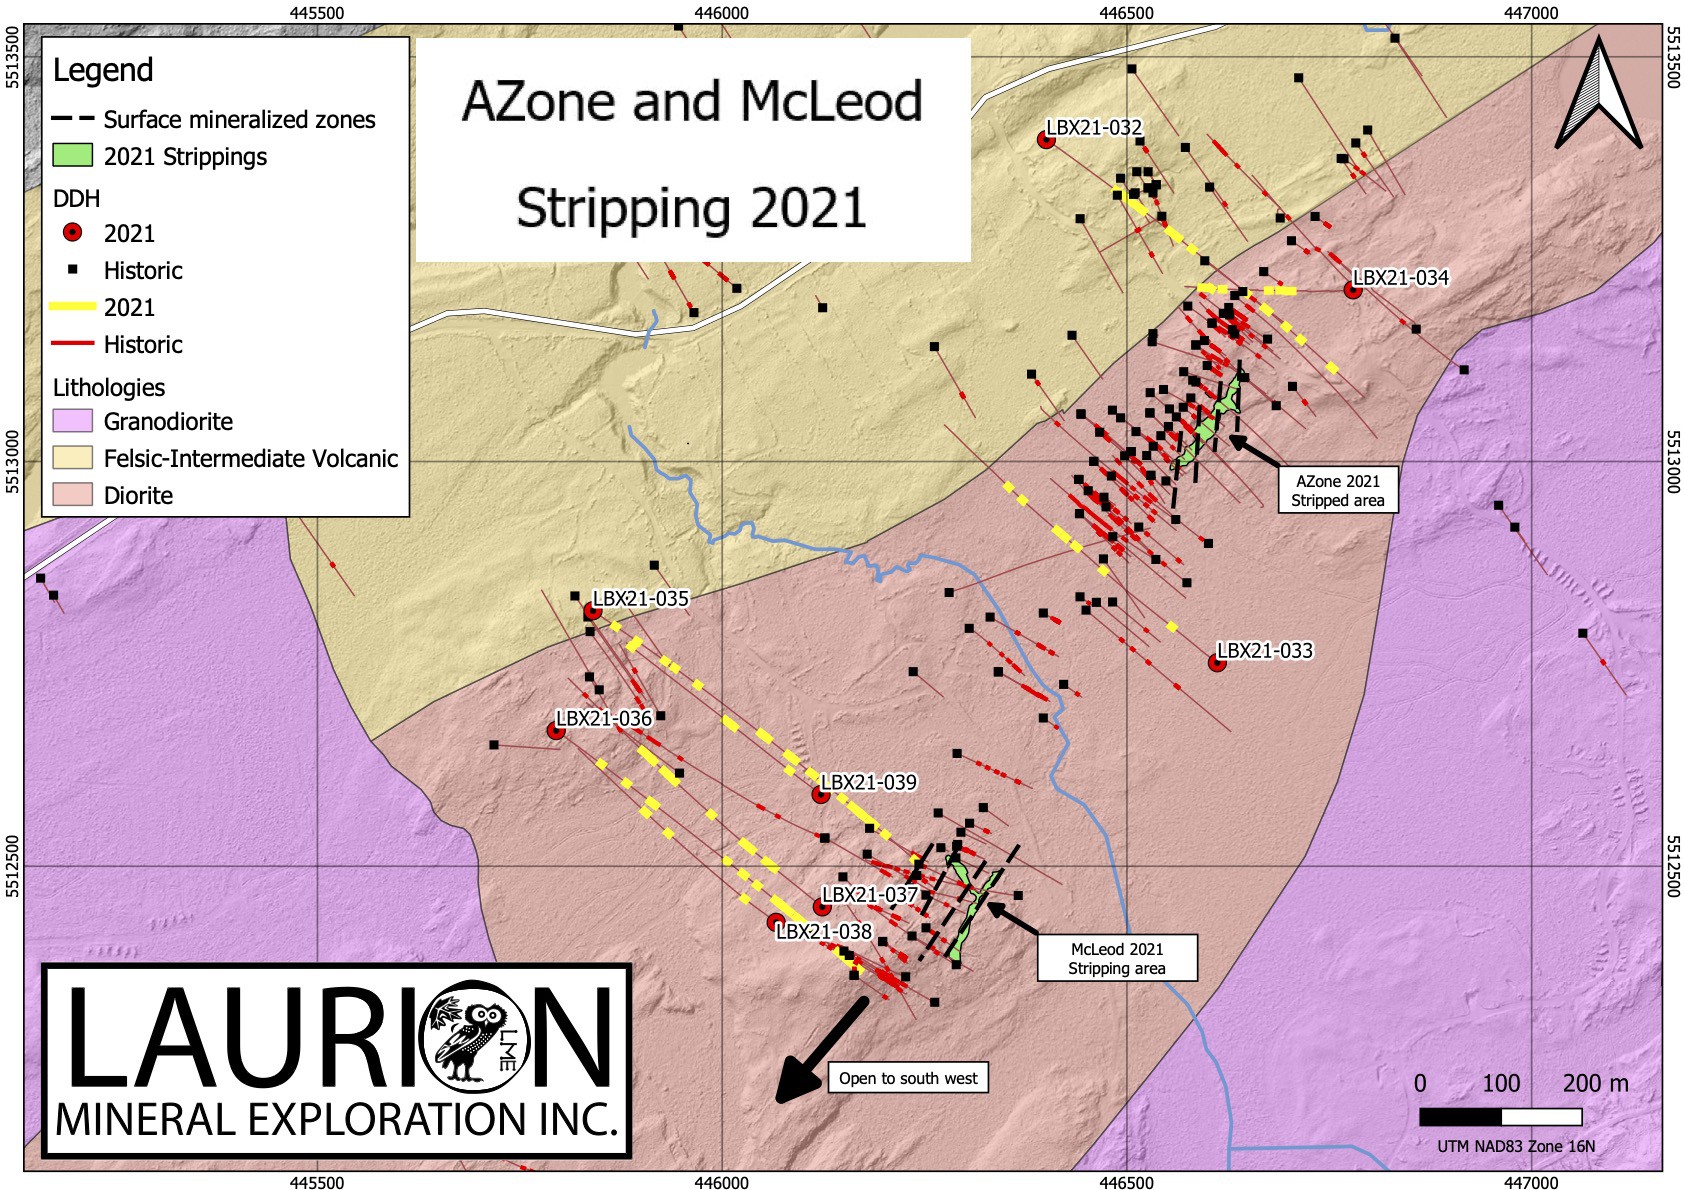
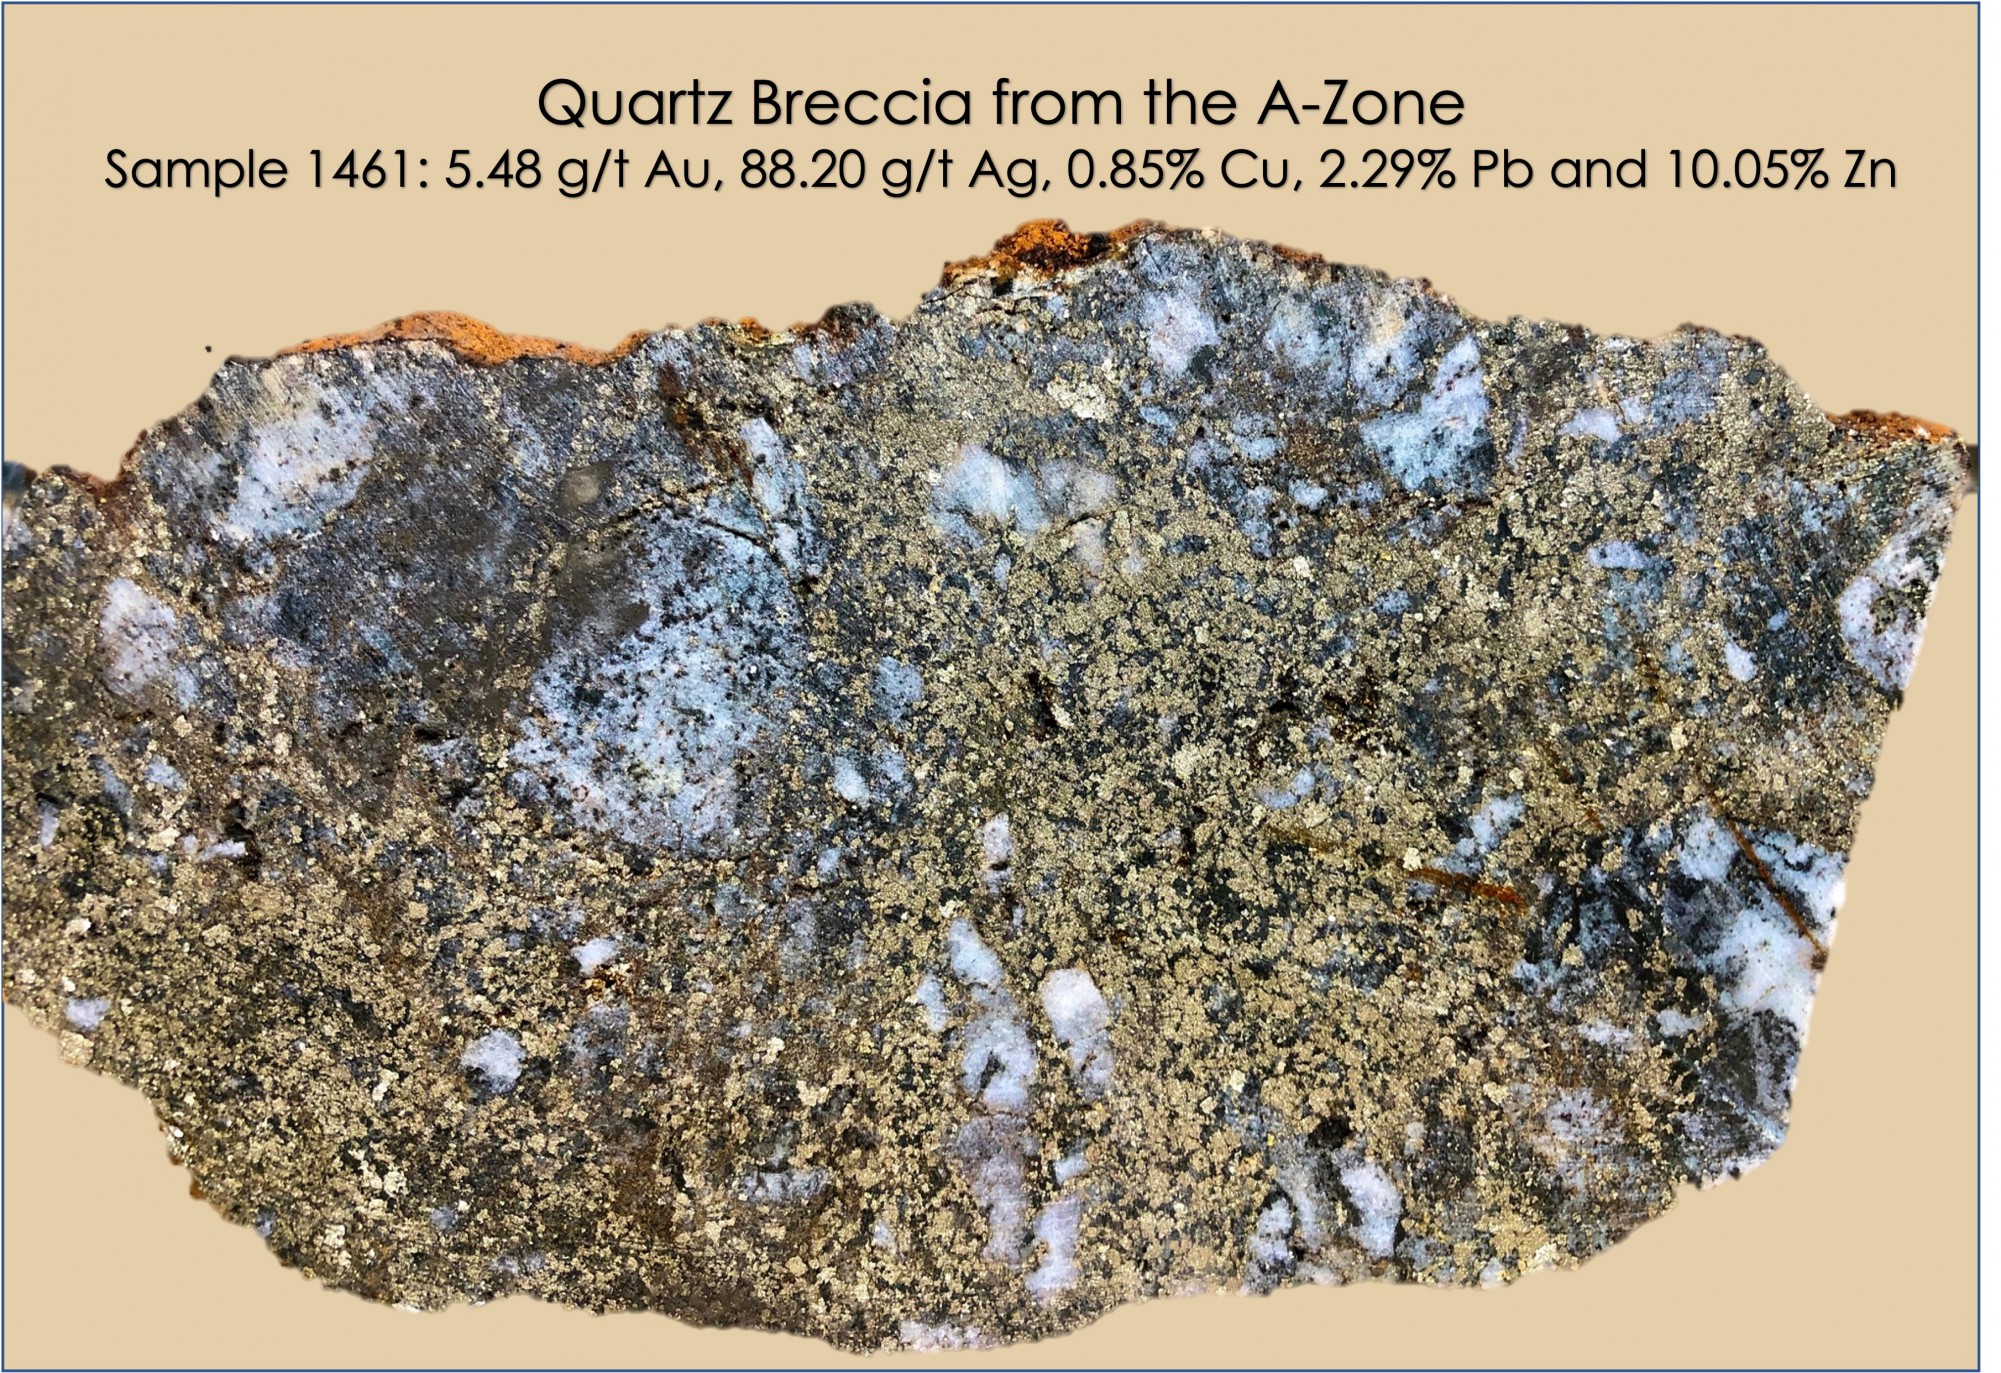
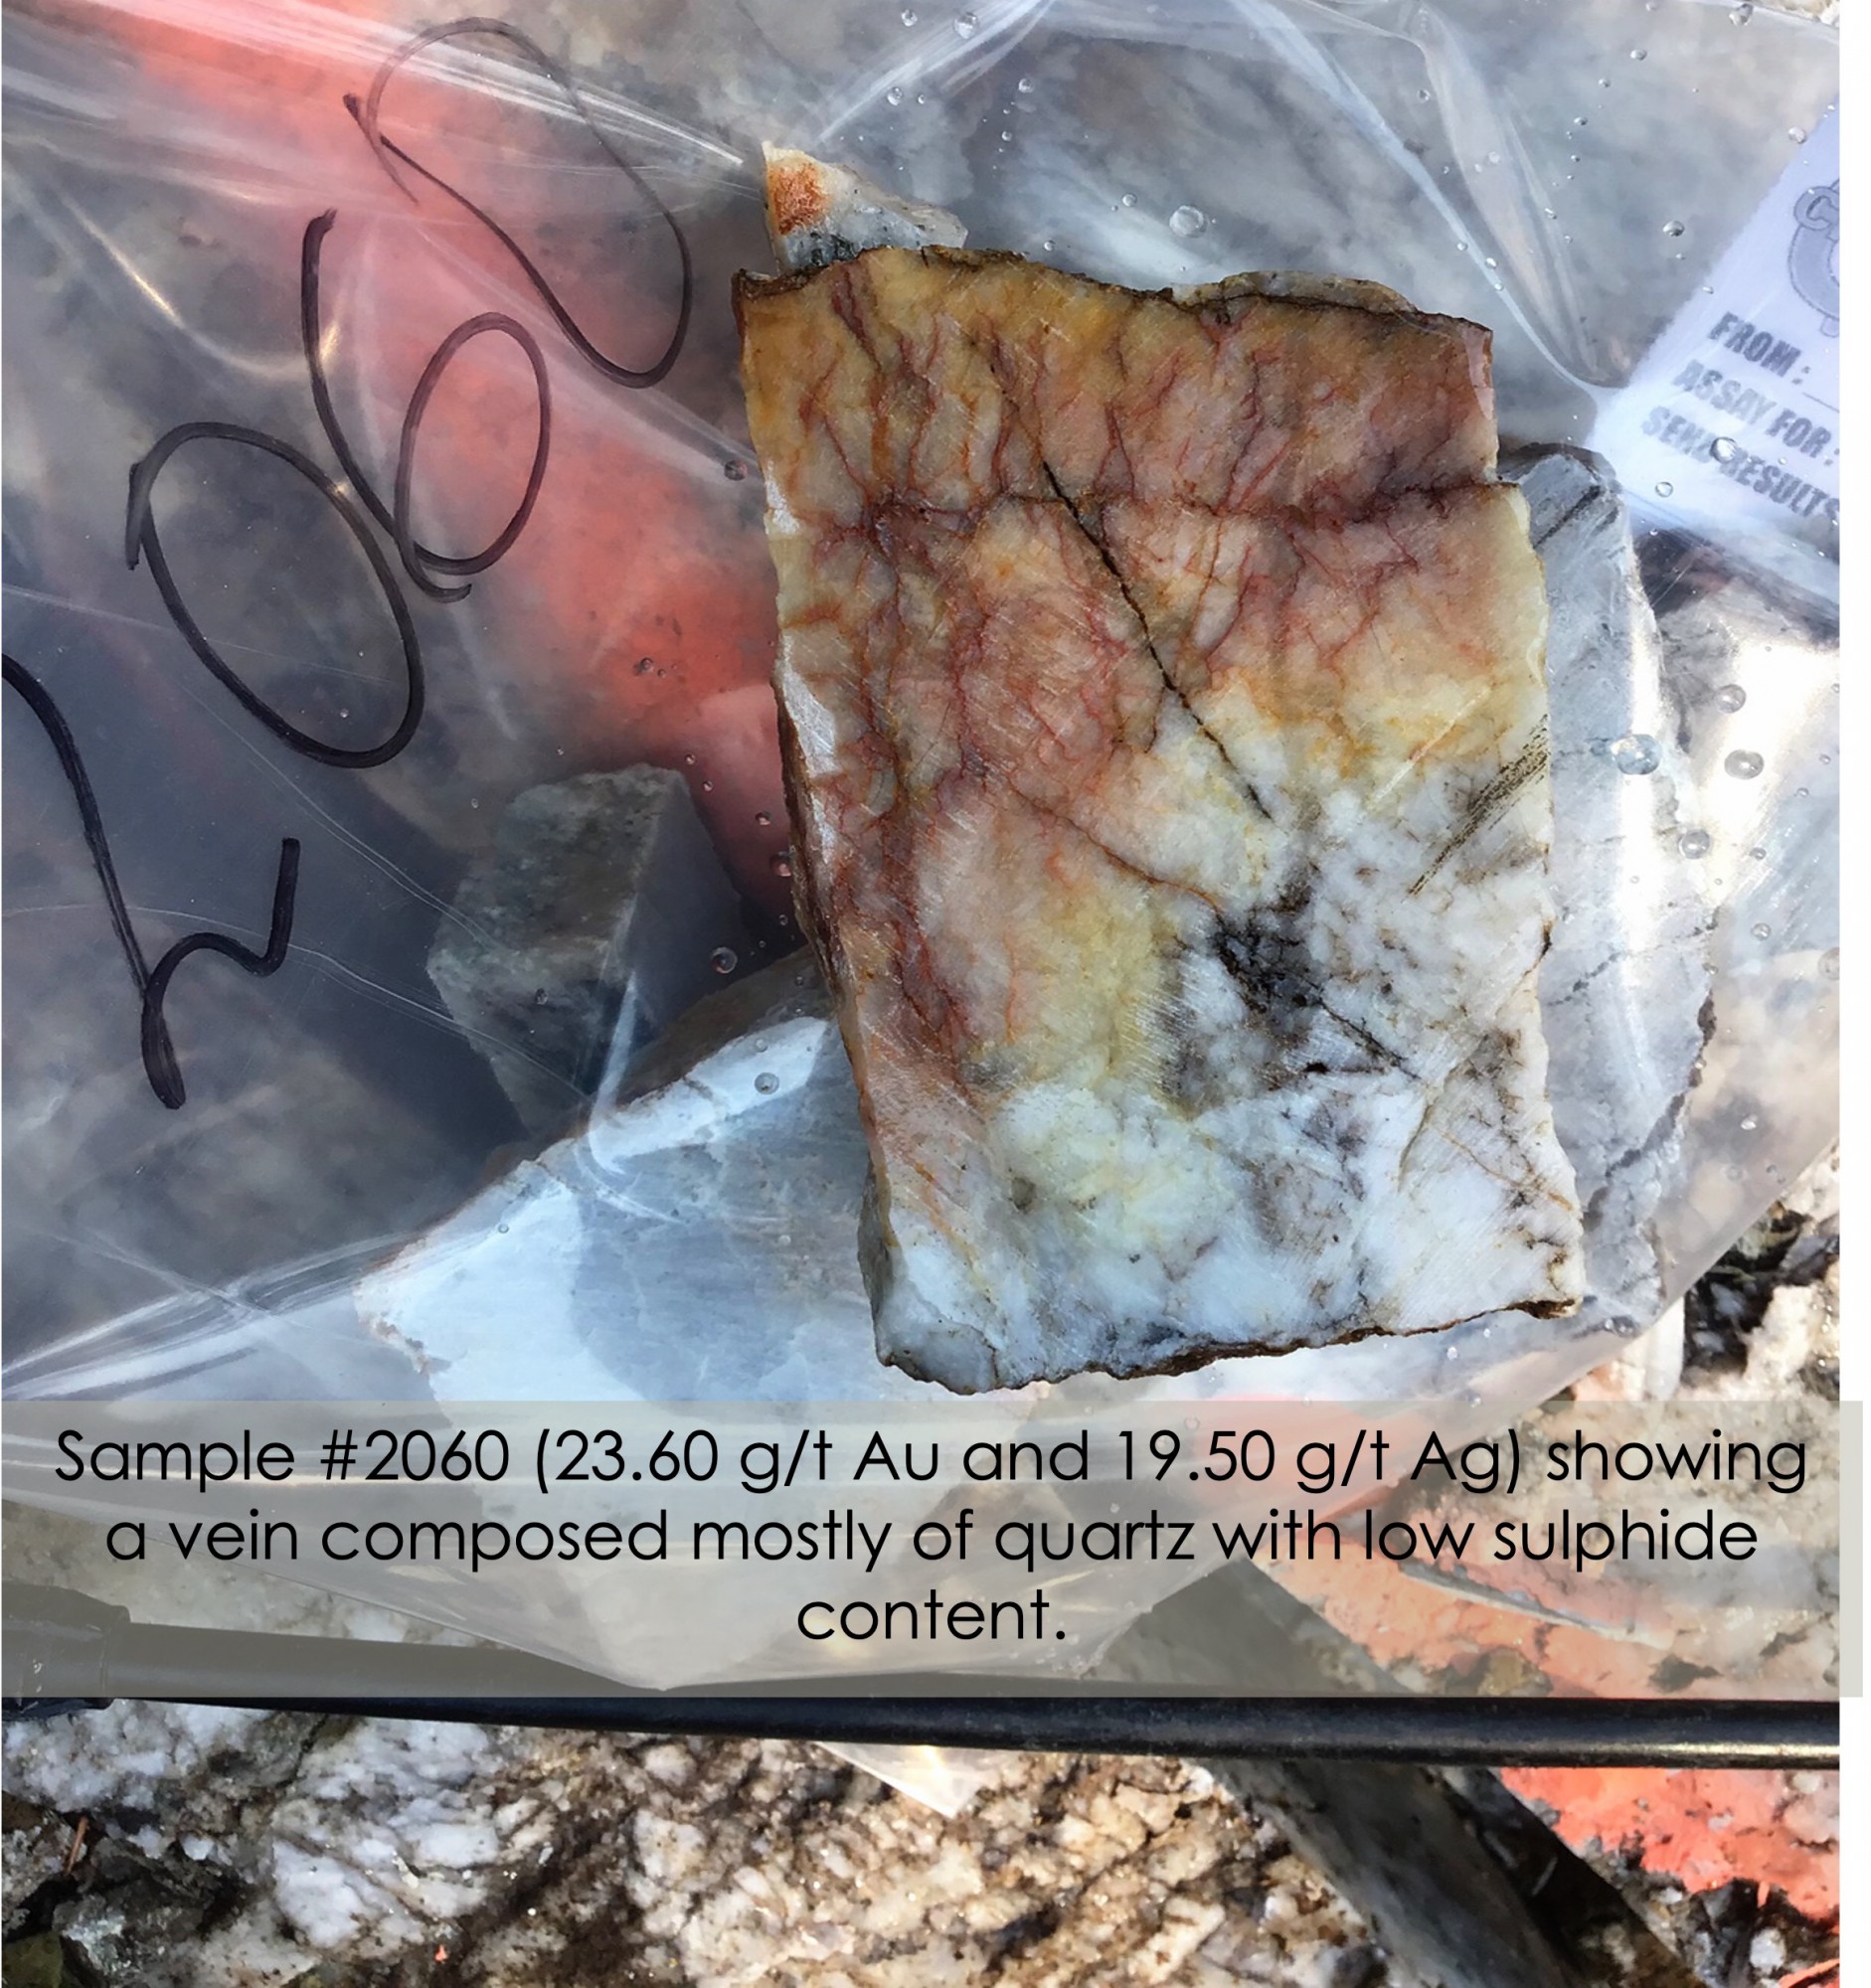
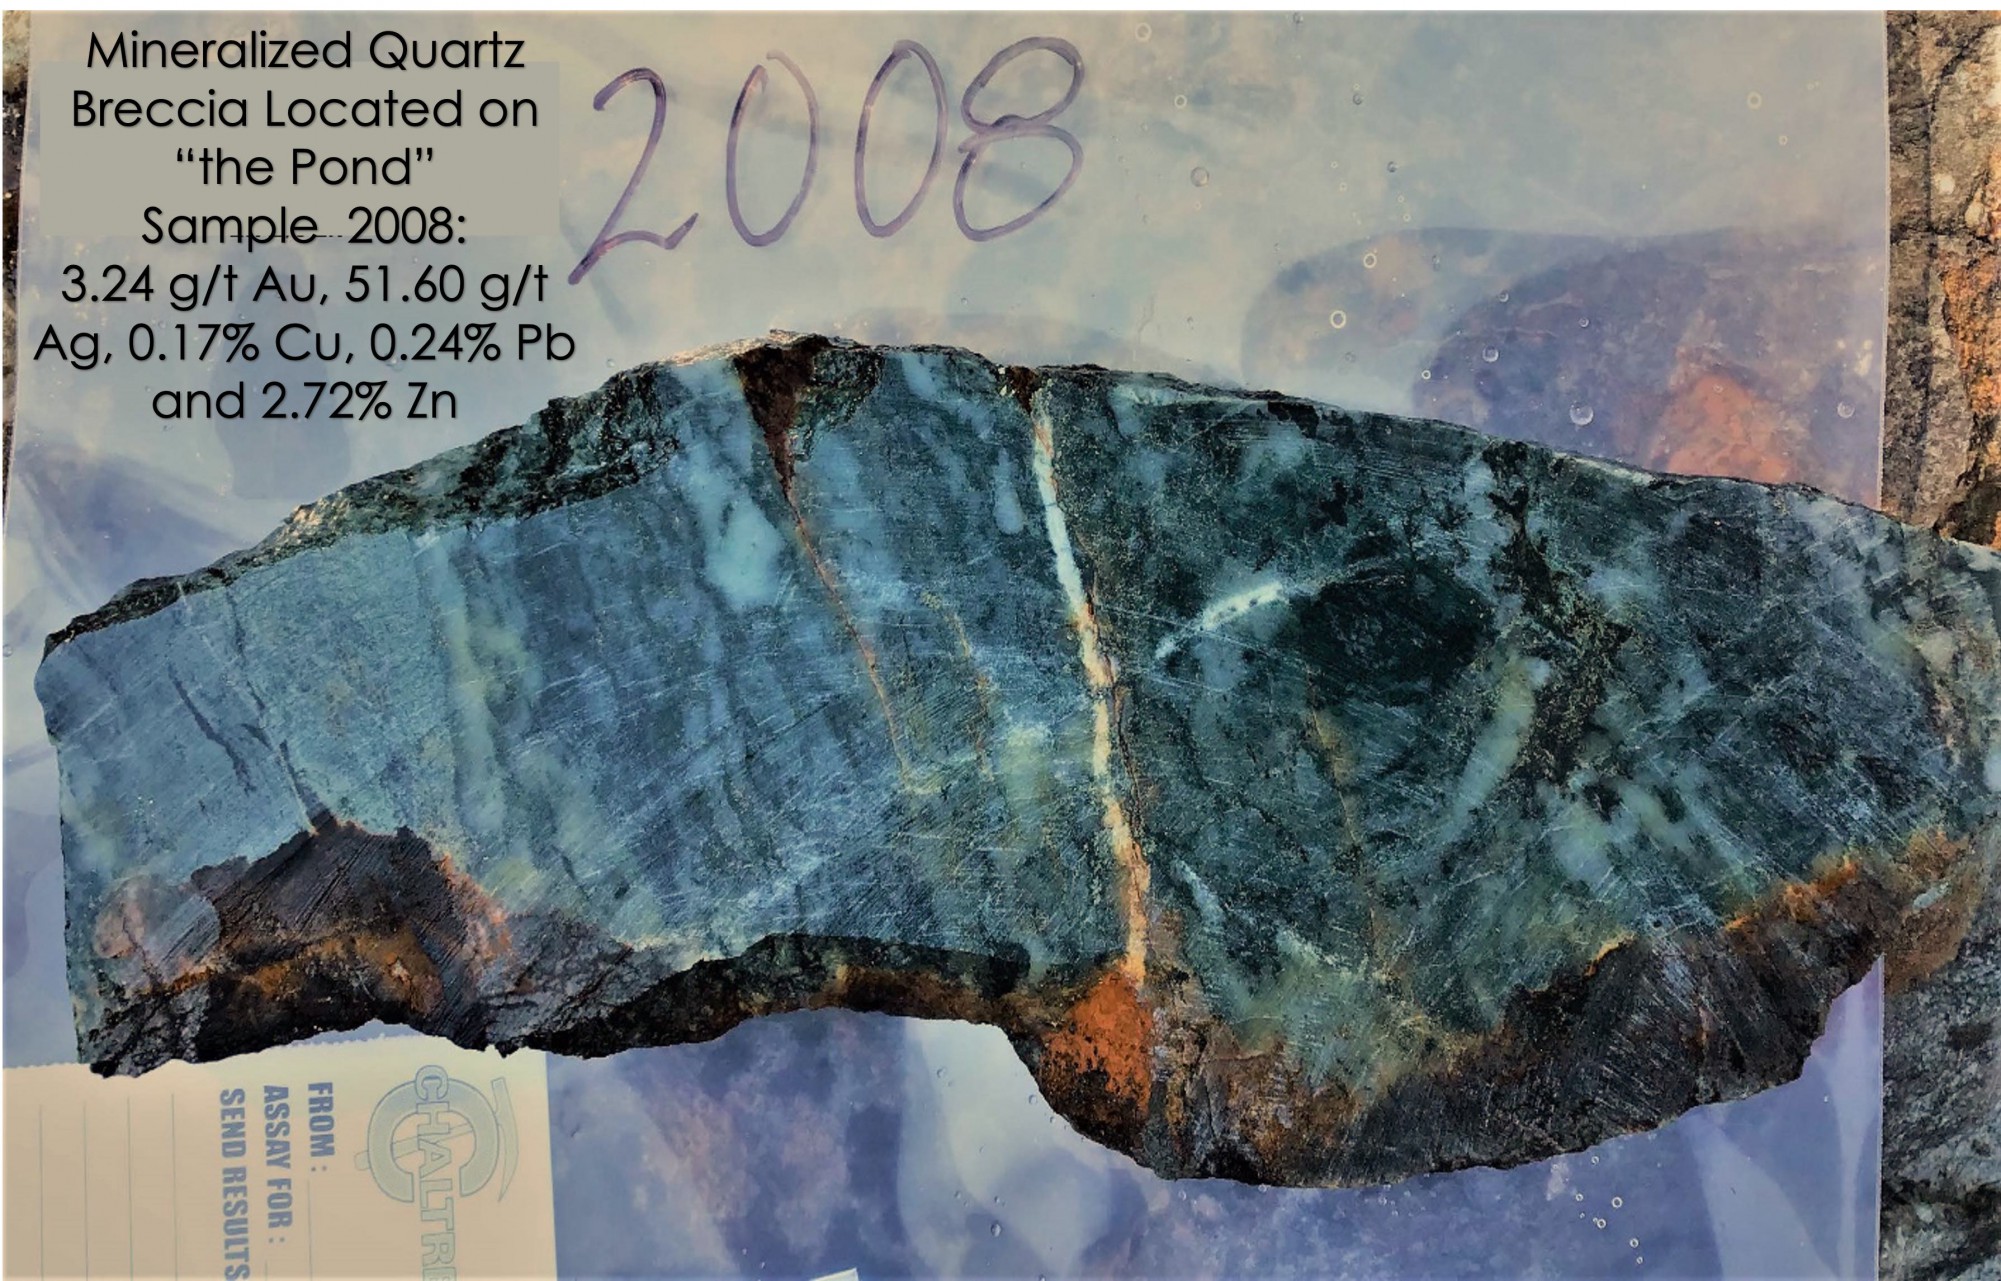
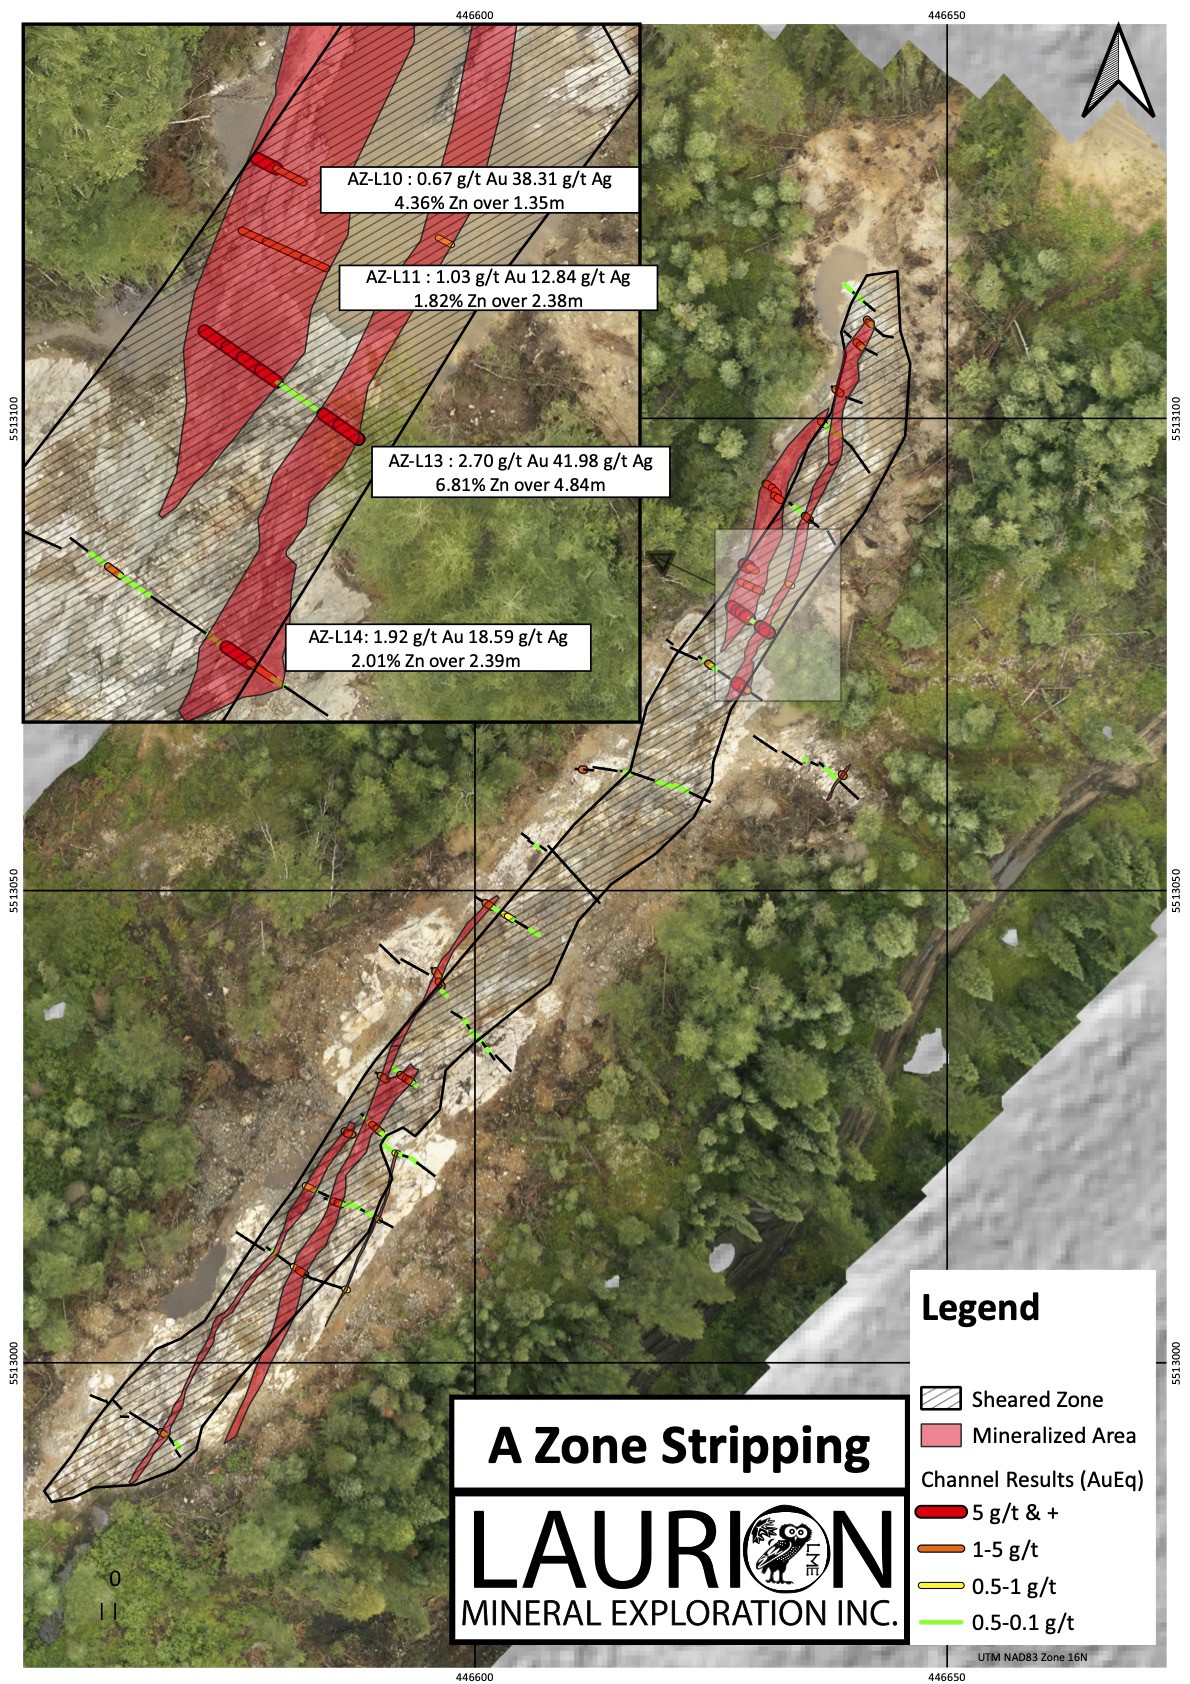
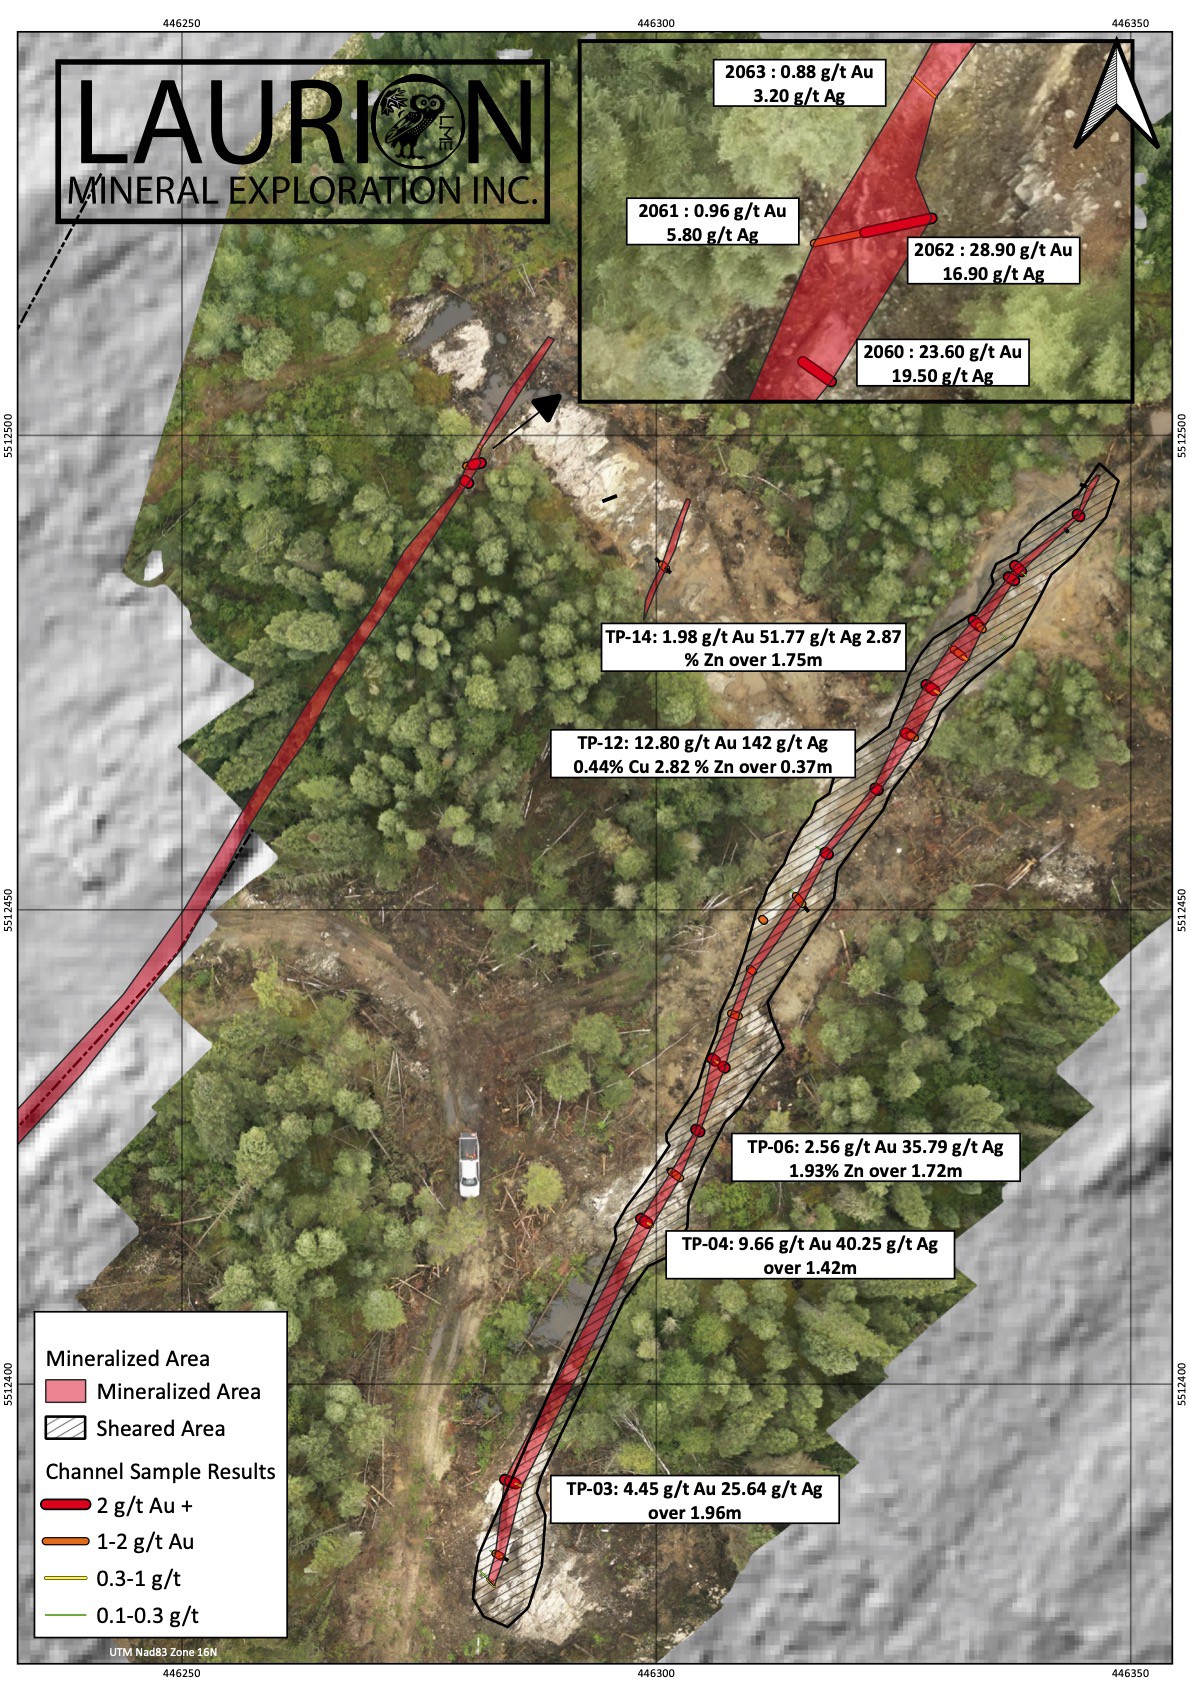
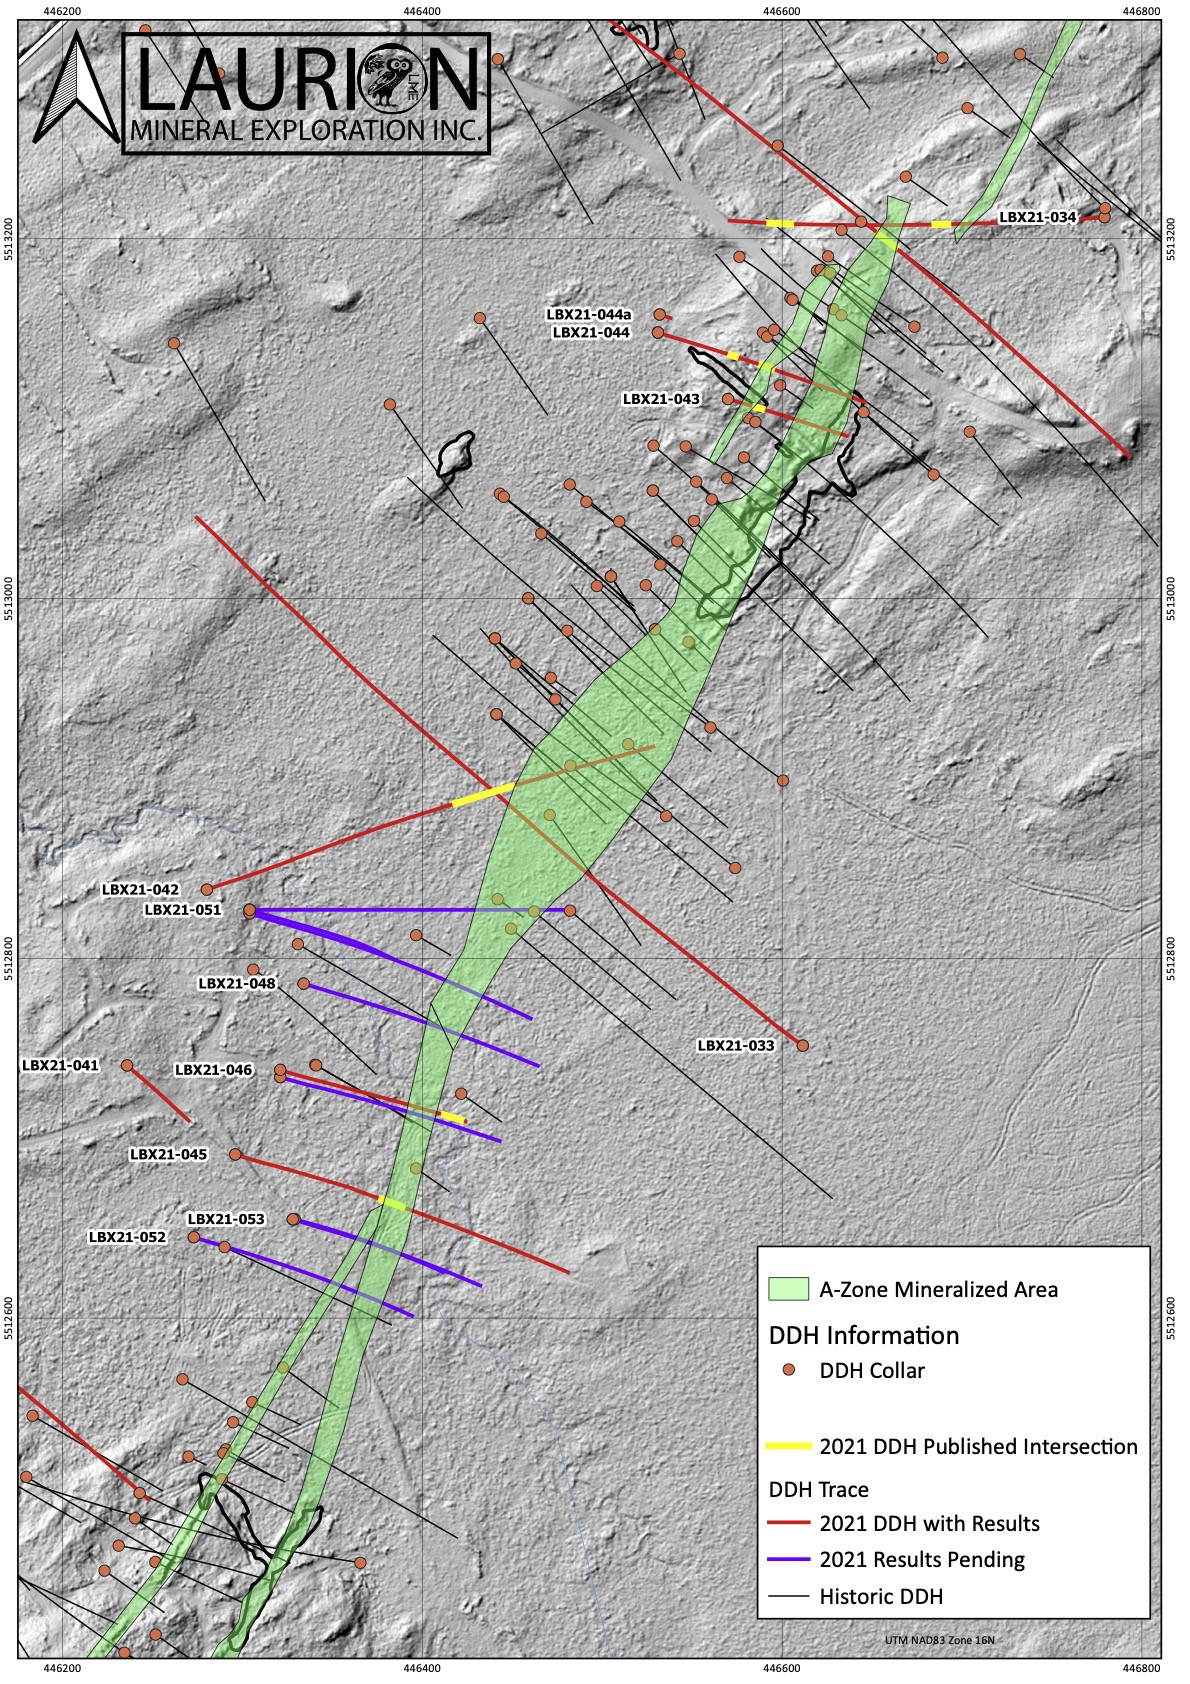
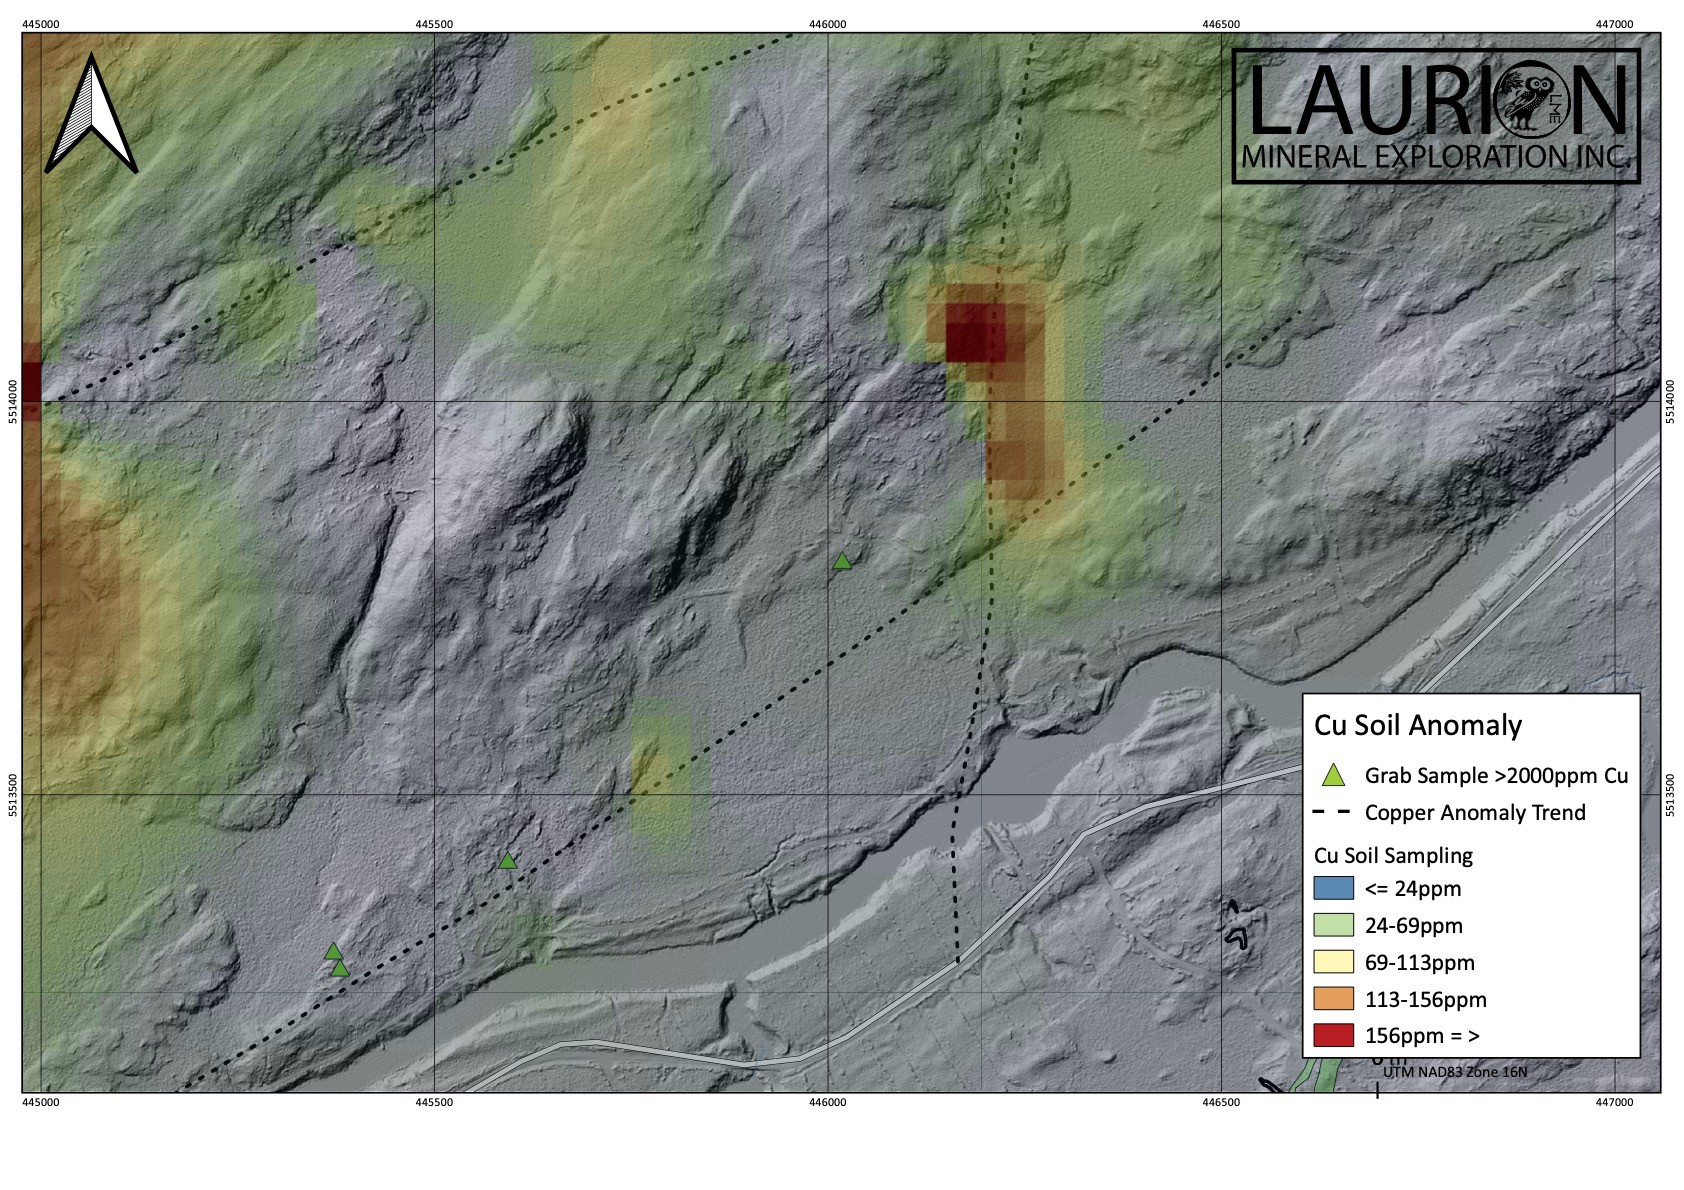
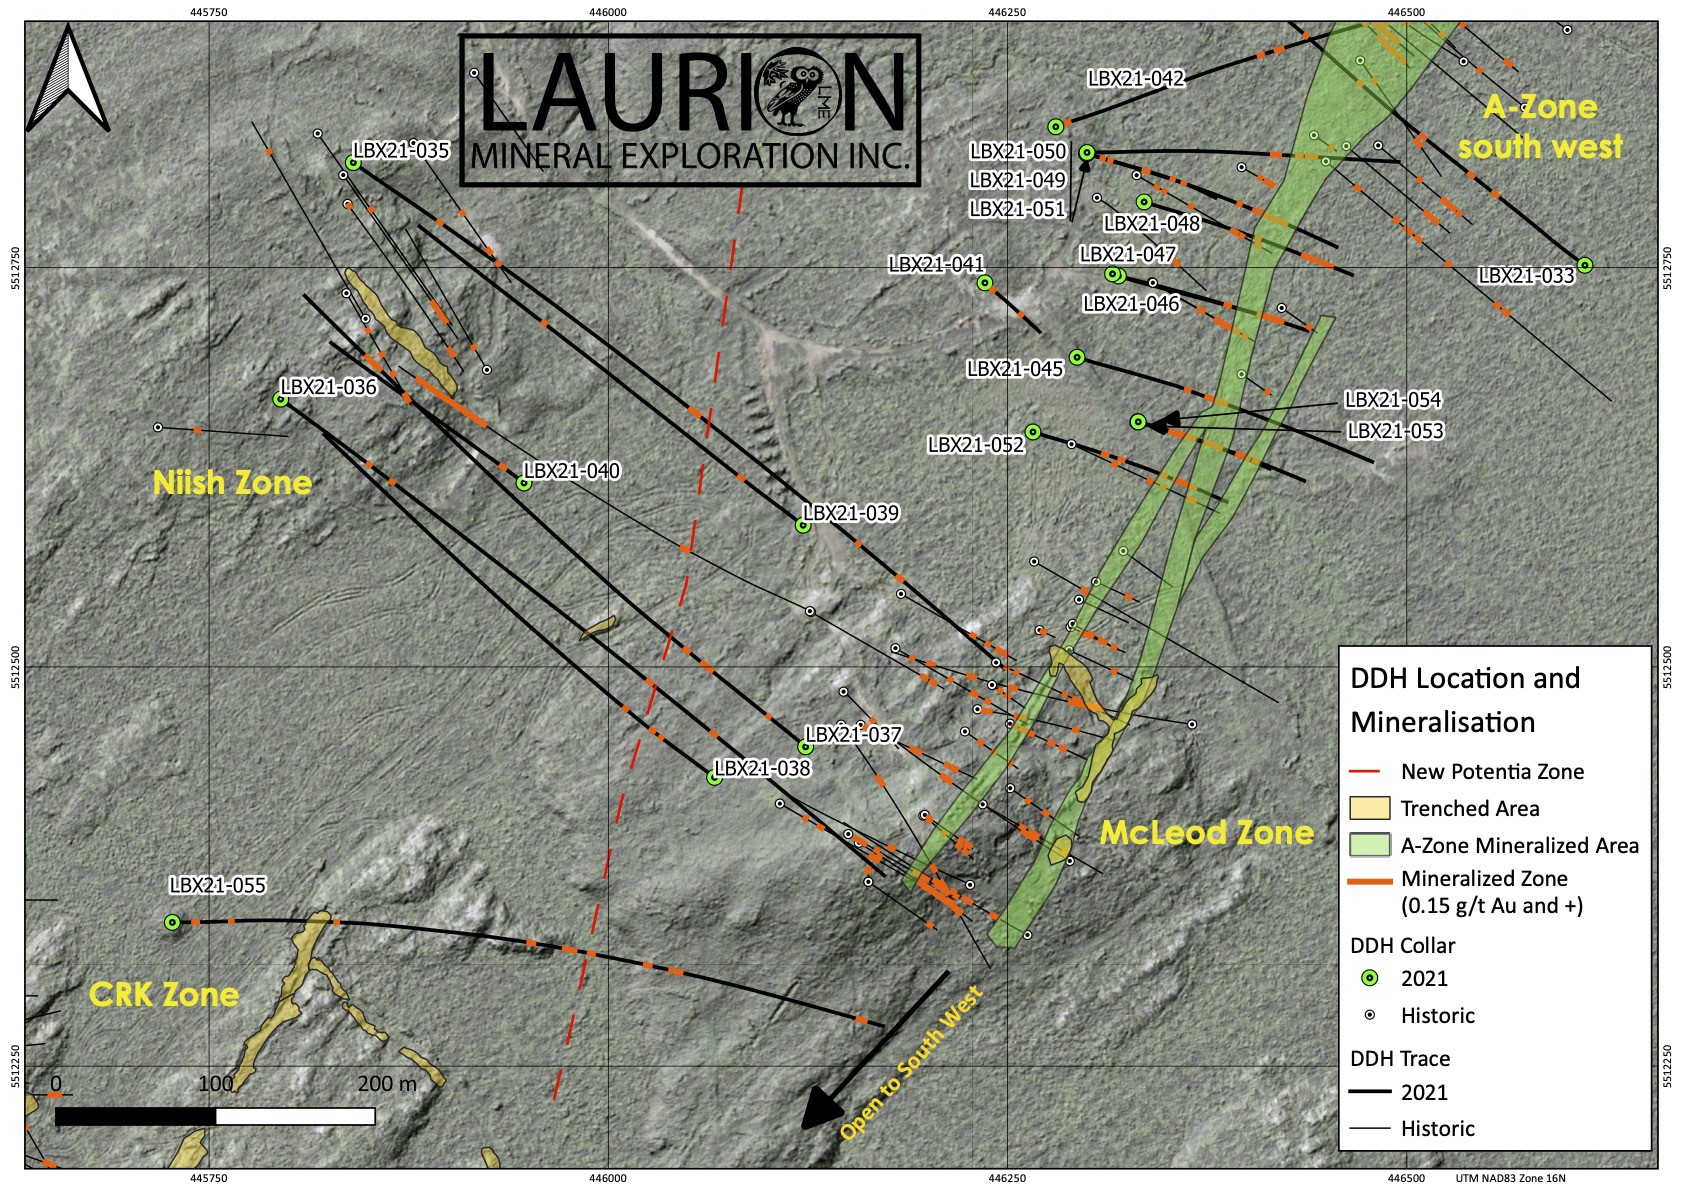
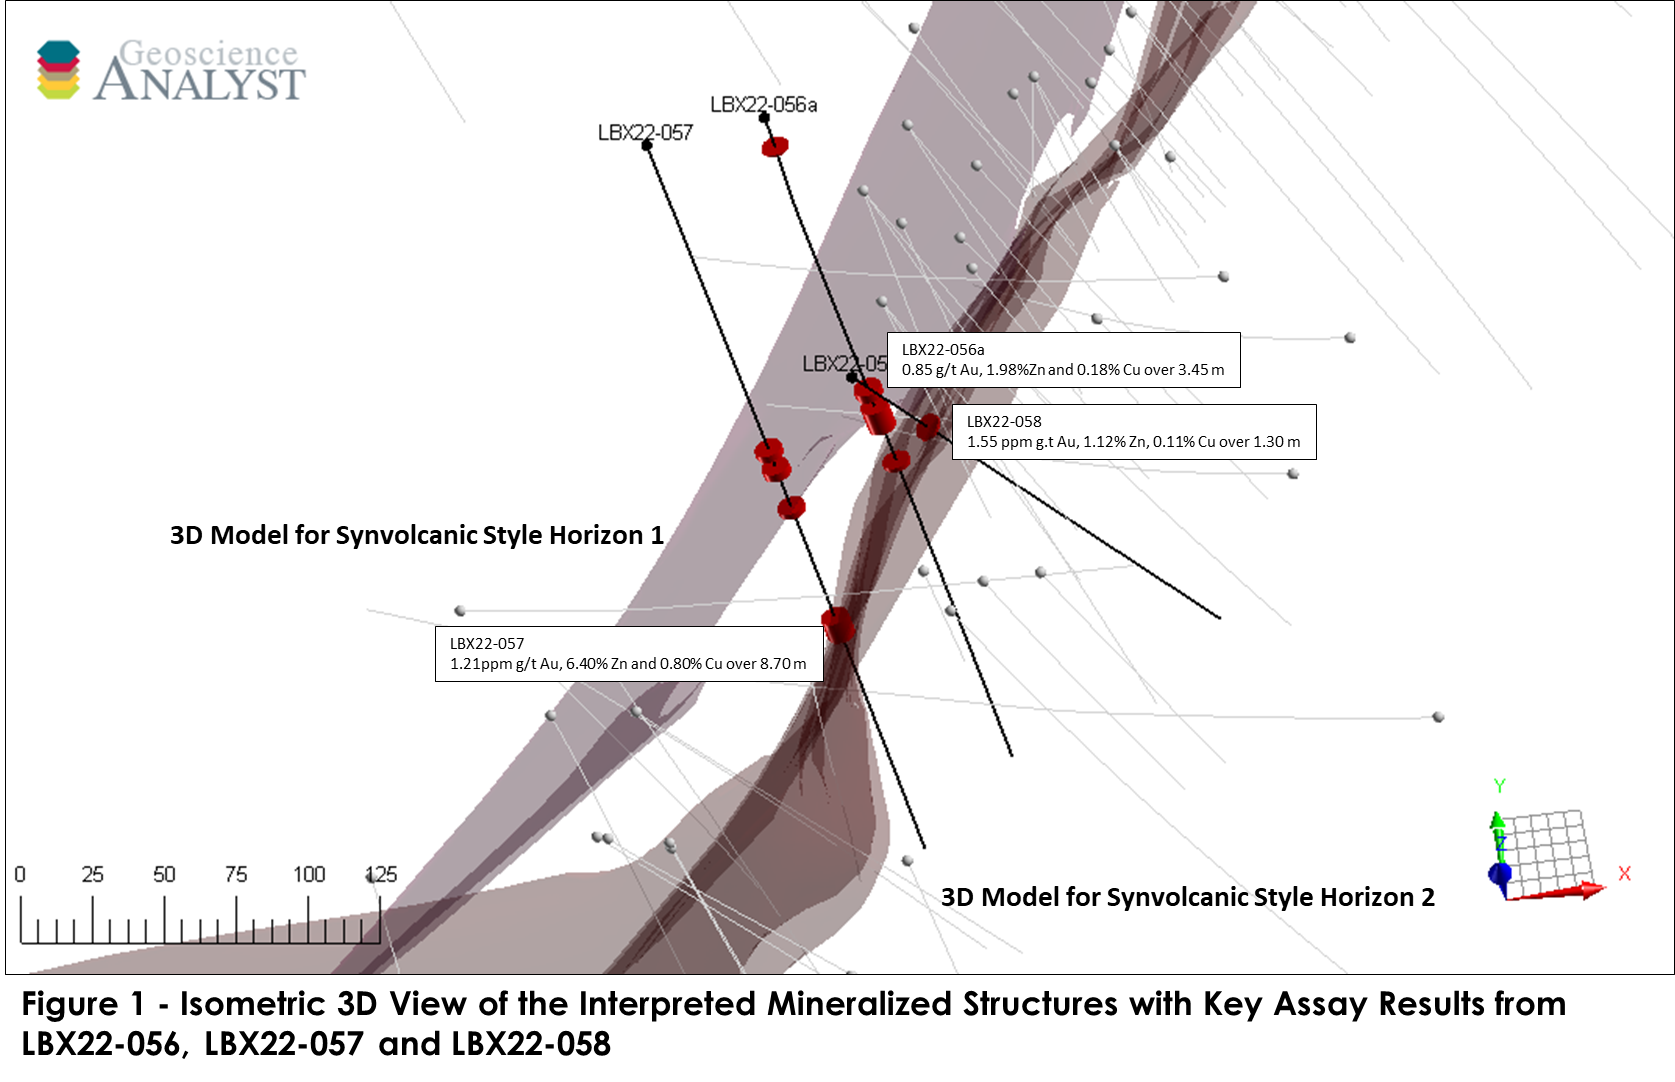
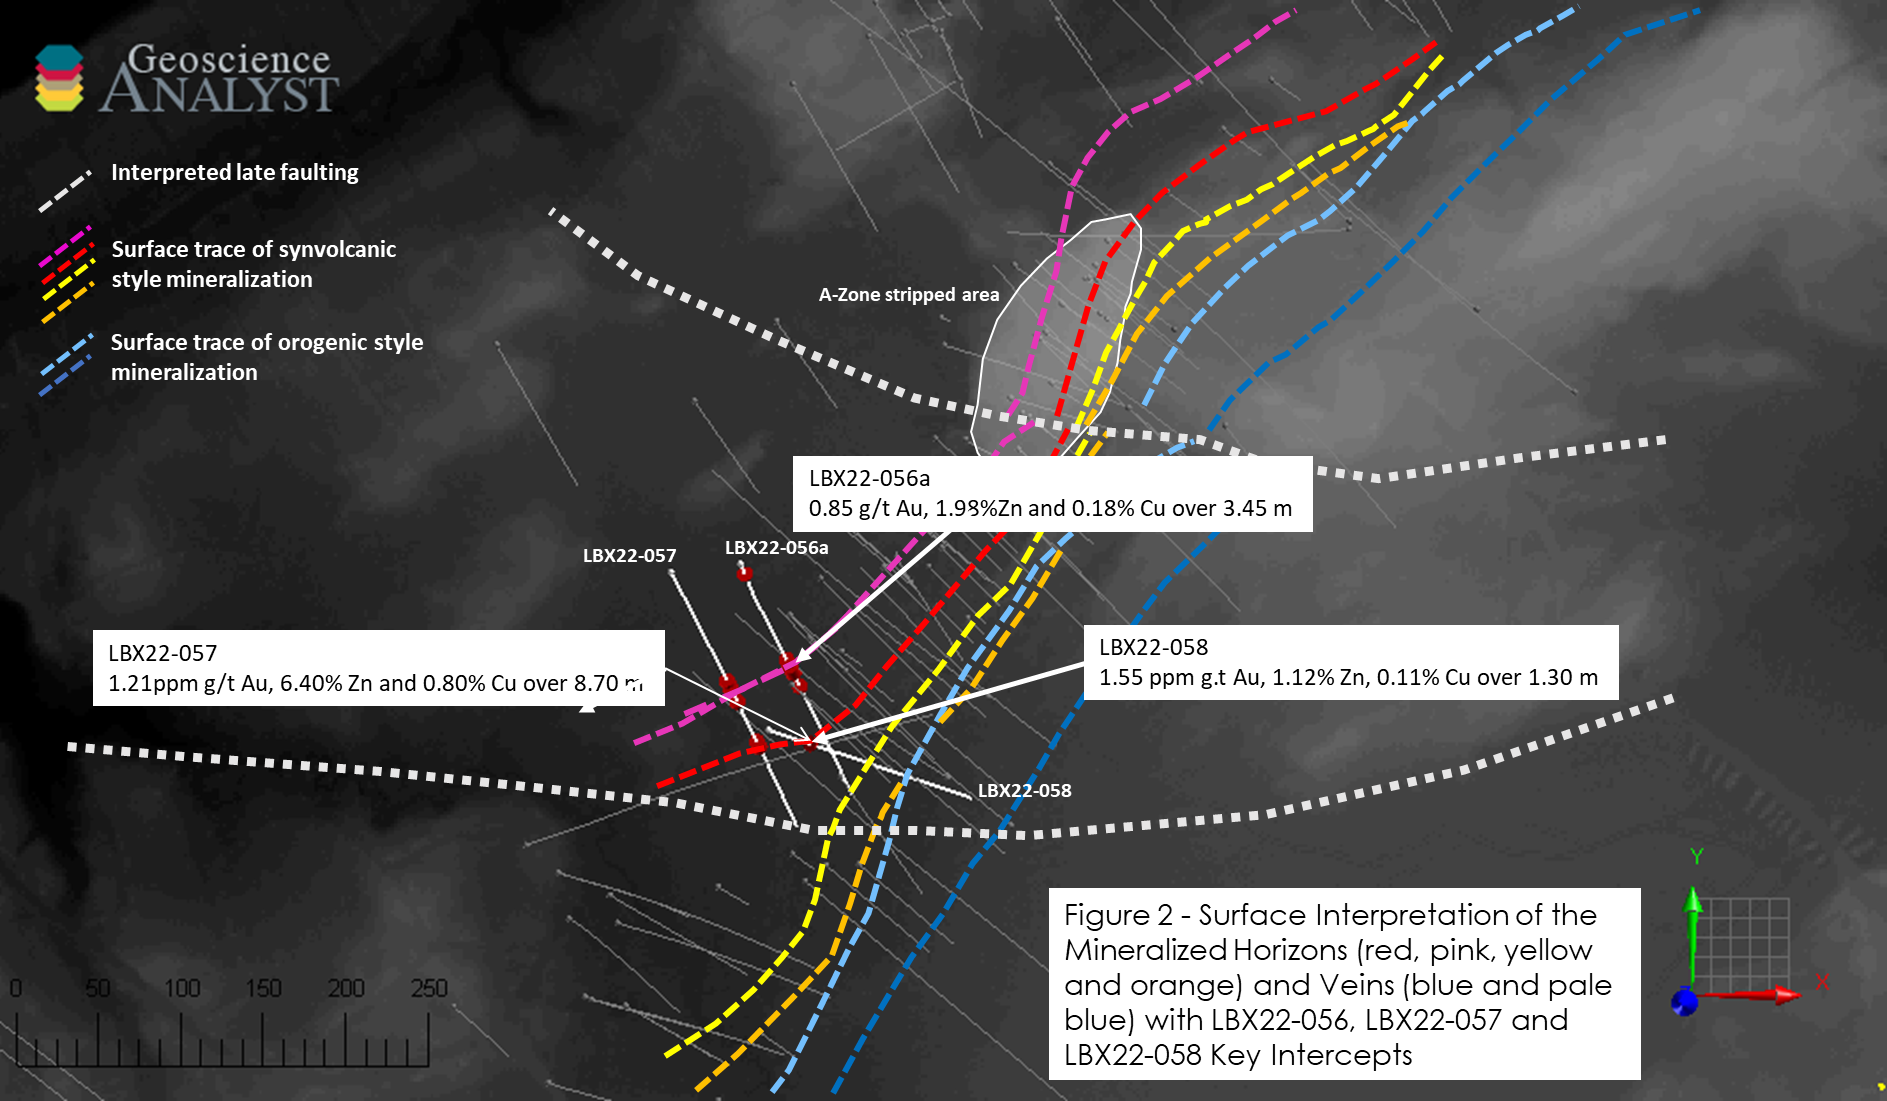
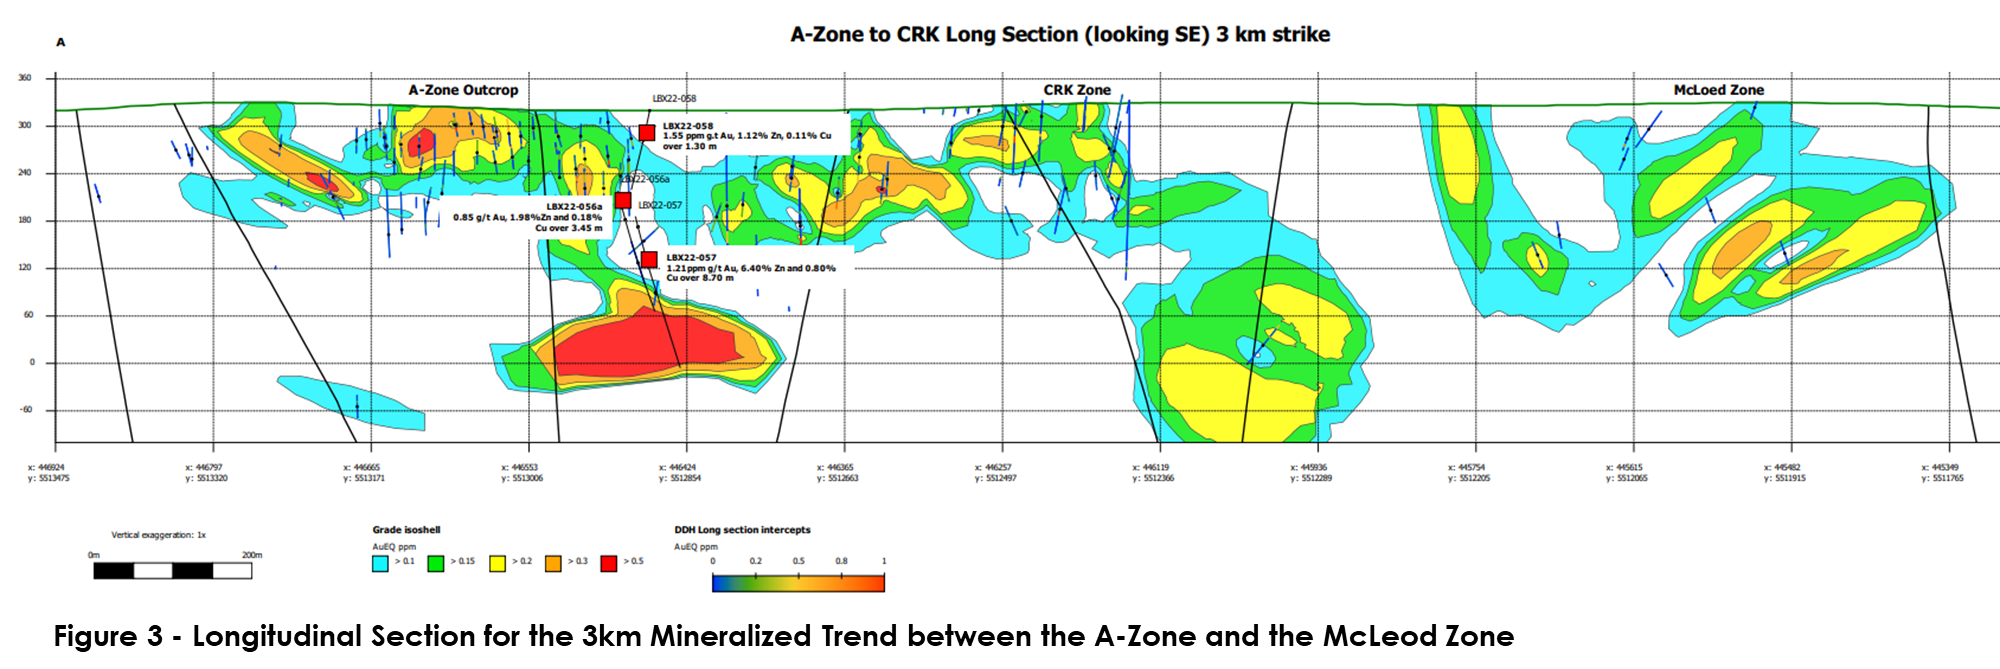
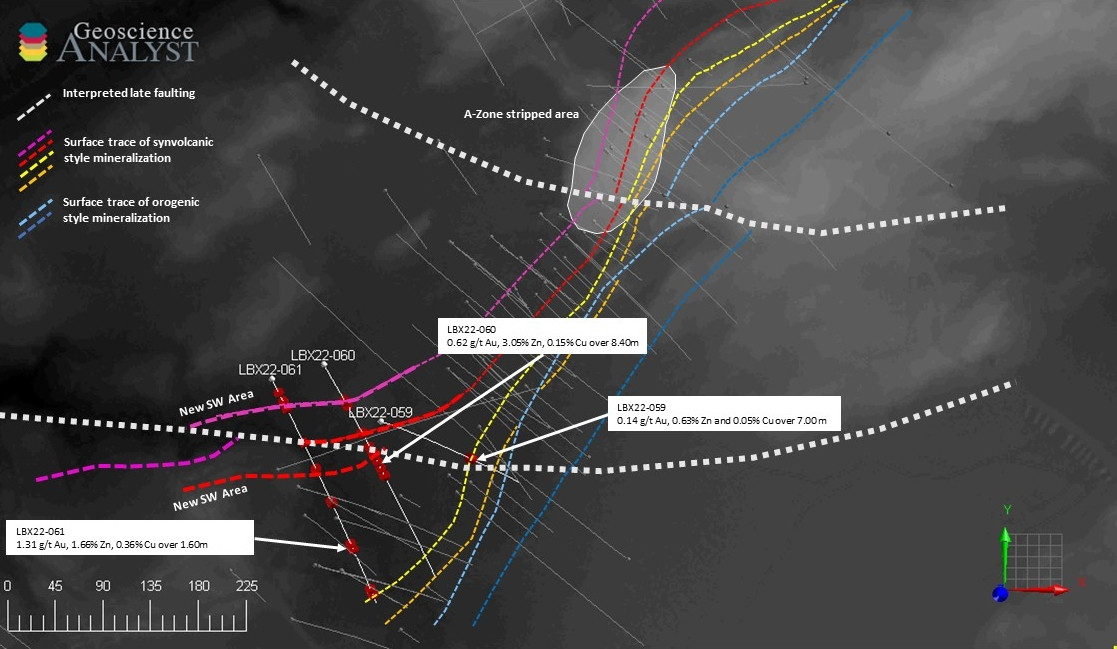
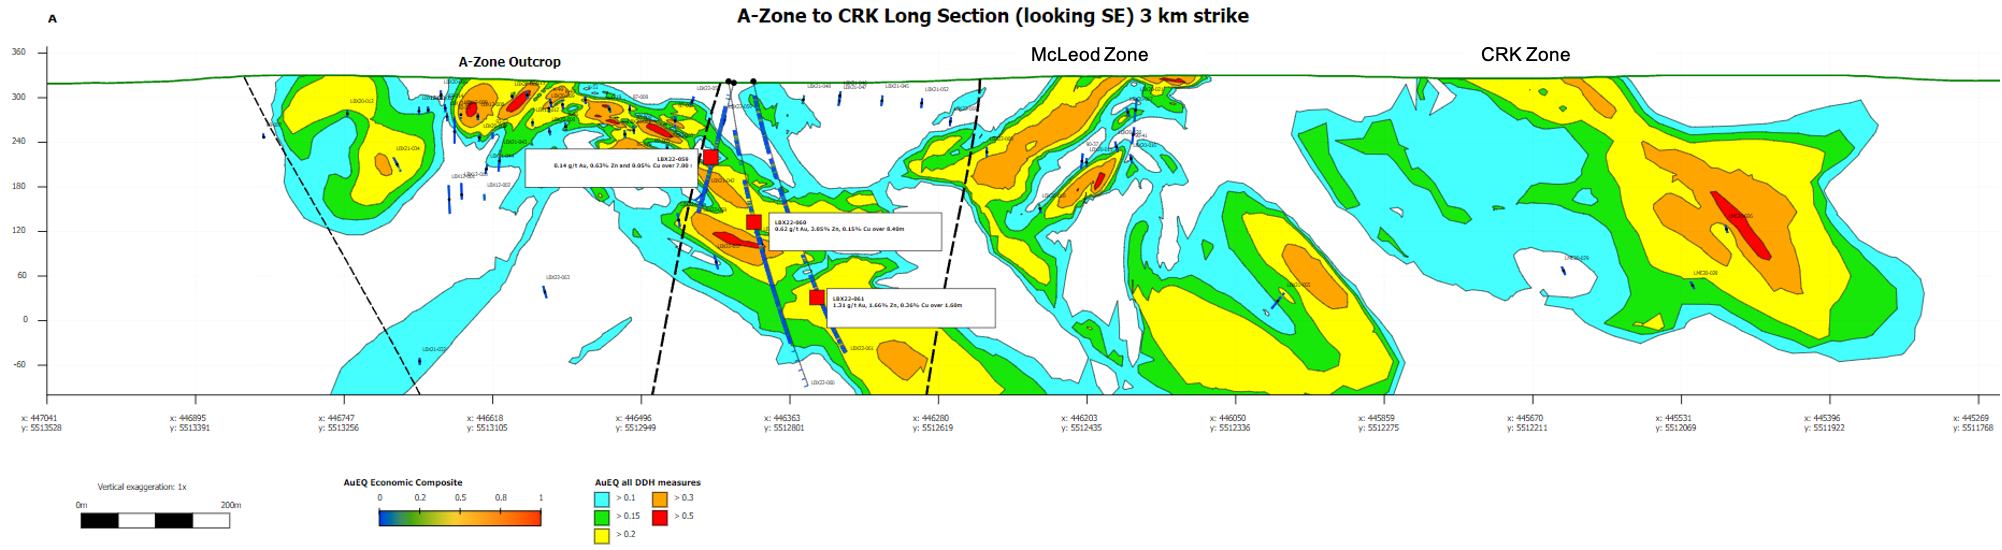
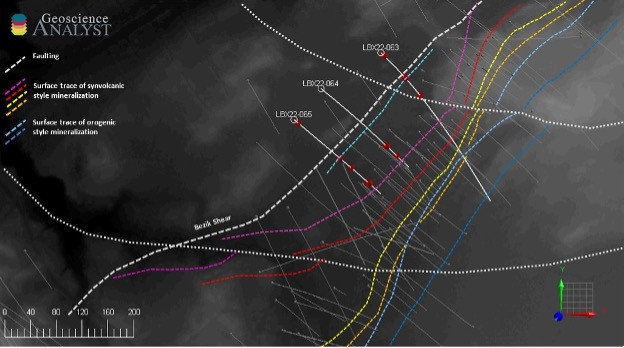
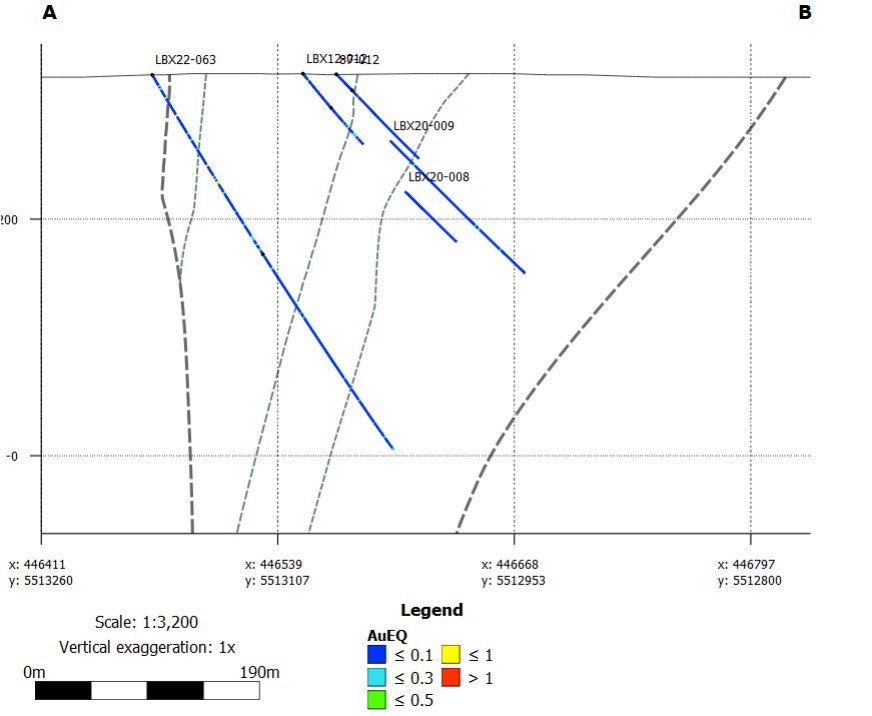
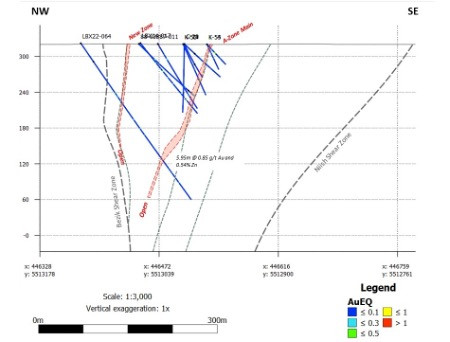
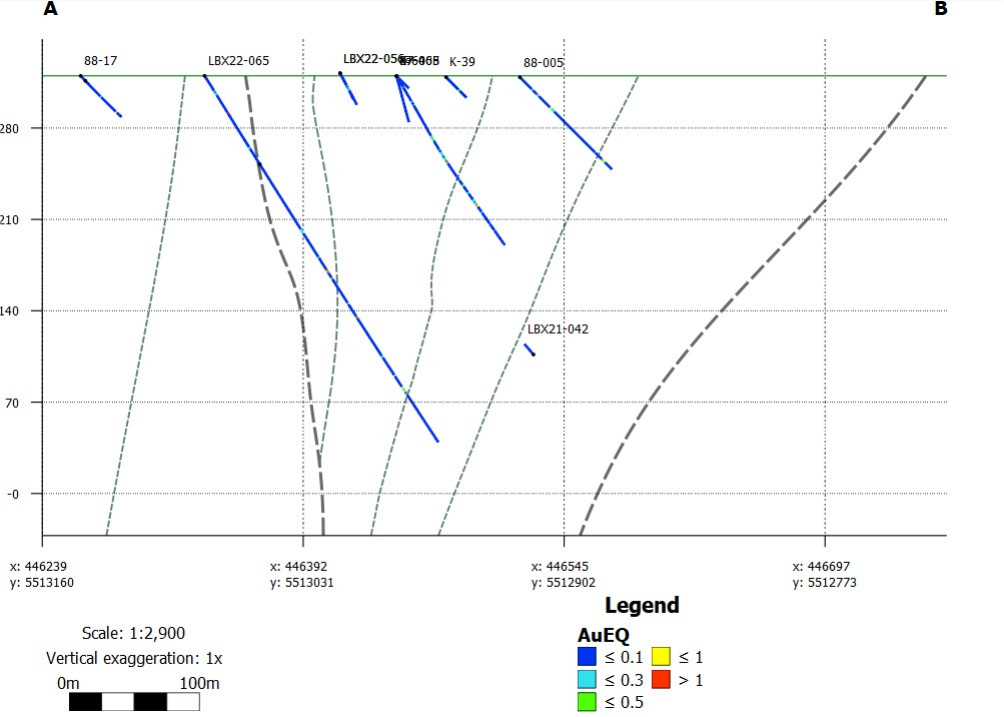
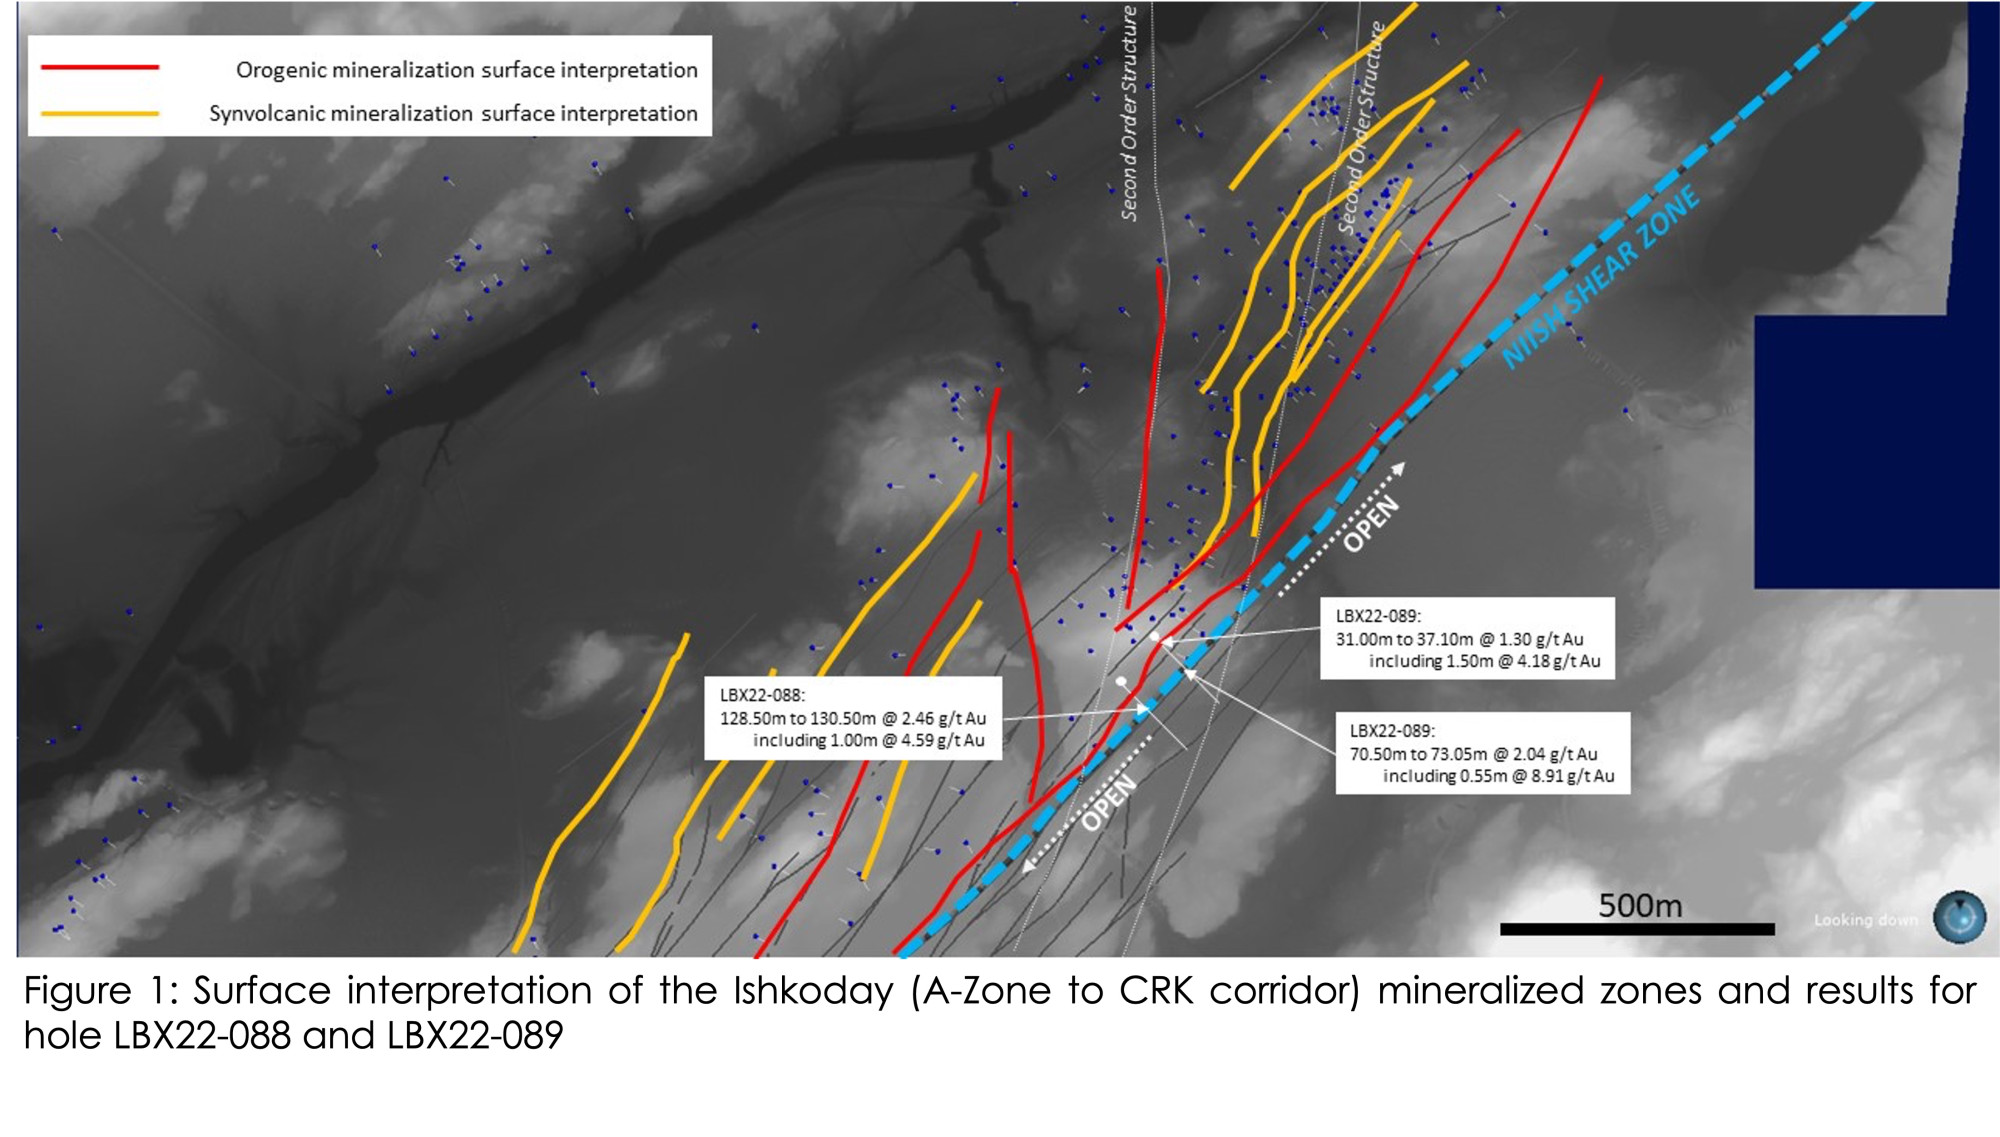
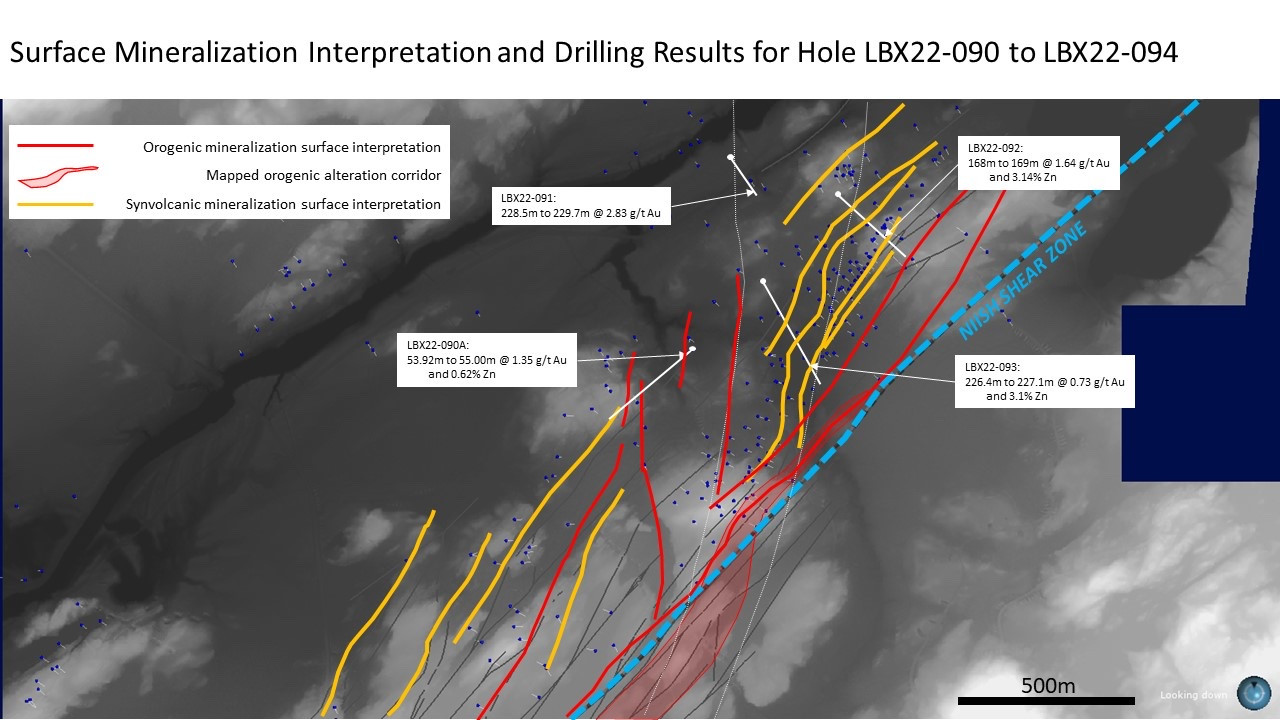
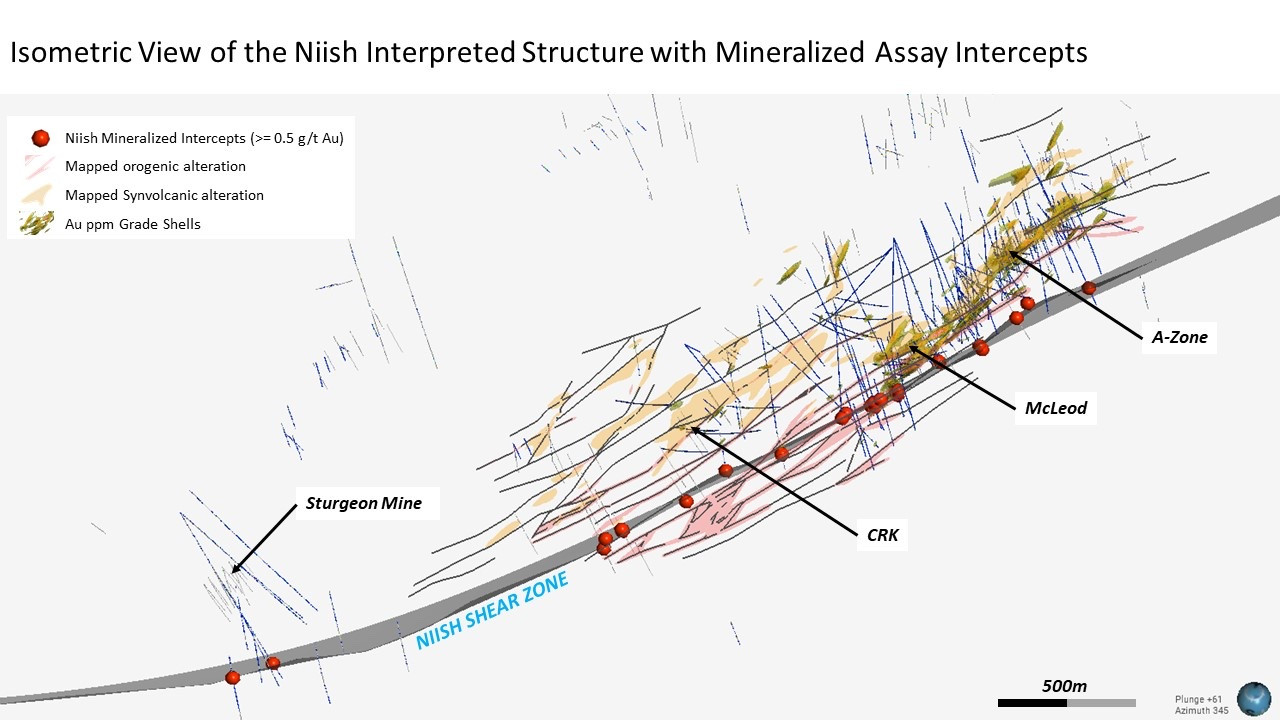
Property Map and Location of the Ishkoday TMI of Ishkoday Property and Mineralized and ZonesSection A-A Showing the 5km x 500m Wide CorridorSection A-A Showing Drill Holes on the Loki TrendSturgeon River Mine Shaft over IVD MAGSturgeon River Mine Shaft over Geology MapSturgeon Rive Mine Shaft over IVD MAG 1:7500Figure 1: Sample taken from line AZ-L13 on the A-Zone compose of a quartz breccia in a pyrite/sphalerite matrixFigure 2: Sample #2060 (23.60 g/t Au and 19.50 g/t Ag) showing a vein composed mostly of quartz with low sulphide content.Figure 3: Sample #2008 showing the brecciated polymetallic vein of the Pond, the sample shows a silicified breccia within a matrix composed of quartz, pyrite, sphalerite, chalcopyrite, galena and chlorite. Figure 4 : Stripped, trenched and channel sampling image of the A-ZoneFigures 5 and 6: Stripping, Trenching and Channel Sampling of "the Pond" at McLeod ZoneFigure 1 - Isometric 3D View of the Interpreted Mineralized Structures with Key Assay Results from LBX22-056, LBX22-057 and LBX22-058Figure 3 - Longitudinal Section for the 3km Mineralized Trend between the A-Zone and the McLeod ZoneFigure 1: Surface interpretation of the mineralized horizons and veins with LBX22-059, LBX22-060 and LBX22-061 key interceptsFigure 2: Longitudinal section for the 3km mineralized trend between A-Zone and McLeod ZoneFigure 1: Surface interpretation of the mineralized horizons and veins with LBX22-063, LBX22-064 and LBX22-065 key interceptsFigure 2: Schematic section along LBX22-063 showing main interceptsFigure 3: Schematic section along LBX22-064 showing main interceptsFigure 4: Schematic section along LBX22-065 showing main intercepts